
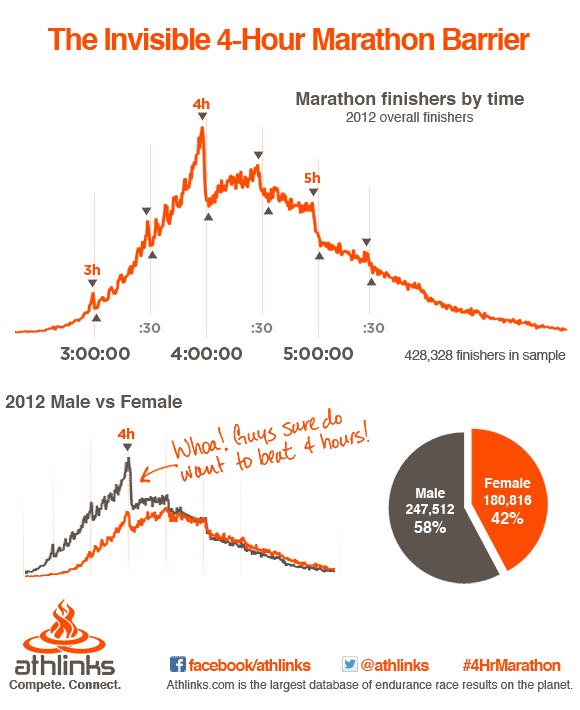
The distributions show the psychological effects of goal times. The most striking are at 4 hours and 5 hours, with the sharp drops on the hour suggesting that a lot of runners are aiming at just beating that particular time. Indeed, if I ever ran one, I would probably be aiming at 4 hours, or more likely 4 hours 30 minutes, which is a nice round number. In my first half marathon, I beat the 2 hour mark by only 15 seconds, and if it wasn't for a sprint at the in order to pip the 2 hour mark, I wouldn't have made.
What intrigues me is whether runners are really competing to their full potential. If you took away the clock, clearly you wouldn't have these invisible barriers - you'd have a nice smooth curve. But are runners performing better than they ordinarily would, or are they pacing themselves to hit certain times? Let me know what you think.
For a description of what drives the above curve (bar the invisible barriers), see this post I put together on an ocean swim I did - you can't see the clock in an ocean swim so the invisible barriers aren't apparent.


