Wednesday 23 December 2009

Ode to Pythagorus

Ode to PythagorusWhen cleaning up our spare room, I found this poem I wrote in year 9 maths class. I presume it was a boring class. Looks like nerdiness has early on-set...

Ode to Pythagorus

O Pythagorus, I love thee
Let me count the ways
For your beauty and your genius
I shall love for all the days

Your mind and your body
Have endeared you to me
That a squared plus b squared
Is always nothing but squared c

For you have brought men off the street
To give up the smokes and drink
And to go home of a night
And do homework and think

But you too have your hidden life
And we have seen the light
That you were a fraud
And a clumsy transvestite

But these are your qualities
Qualities that attract us
Even though your name was Betty
And not Pythagorus

Merry Christmas from the Mr (and soon Mrs) Science Show!

Christmas is a time for over-indulgence. But has Santa gone too far?

As Christmas is only two sleeps away, have a listen back to last year's Christmas special on Santa, the fat, diabetic substance abuser (Episode 98). Santa Claus is a ticking time-bomb. Not only does he eat copious amounts of sugar and drink gallons of beer, he is also at risk of altitude sickness, deep-vein thrombosis, jet-lag, zoonotic diseases from exposure to wild reindeer and countless other problems associated with lack of sleep and poor diet. Not to mention all the concerns associated with smoking.

Australian science writer Bianca Nogrady assembled a crack team of health experts to look into the state of the big man, and the prognosis wasn't good. You can read more about the findings of the Santa-team in Bianca's original article for Australian Doctor, Health alert for Christmas visitor.

Listen to this show here:


Continuing the Christmas theme, listen in to some reindeer facts and the problems Santa is having at the North Pole (Episode 95). Due to global warming, and the global financial crisis, in 2008 Santa had to put his North Pole residence up for auction and is currently looking for a new place in Lapland.

Listen to this show here:


Me and EugeMy Christmas treat came early - soon there will be a Mrs Science - thanks Euge for saying yes! One of the conditions, however, is that this moustache never returns...

Thursday 10 December 2009

Ep 119: Alien Vox Pop and (re)introducing The Beer Drinking Scientists

The Beer Drinking Scientists are back! It's been two and a half years since our last episode, but Darren Osborne, editor of ABC Science Online, and I have got back together over a beer in Sydney to chat about the pressing scientific issues of the day - in this case, alien life. We chat about the latest scientific research and discoveries in areas such as astrobiology, SETI and exoplanets, and also to others in pub to hear their opinions.

In this episode, you can hear the vox pop from the BDS episode - including from one person who swears she has seen not only one UFO, but a UFO release a baby-craft, and another who thinks that Jesus might be an alien...

For the full episode, get over to The Beer Drinking Scientists homepage. If you have the iphone app, you will also get this BDS ep as bonus audio. To bring some sanity to the proceedings, Marc chatted to Dr Carol Oliver from the Australian Centre for Astrobiology before the show and clips from this interview are played throughout. For the full interview with Carol, see the podcast Ep 118: Astrobiology and the search for extraterrestrial life.

We'd love to hear ideas for future BDS episodes, so feel free to leave comments, or let us know on twitter - @bdscientists. We'll release new shows about every 2 months.

Tune in to the podcast here (or press play below):

Monday 30 November 2009

A couple of maths videos

In the last two weeks, I've been sent the following two mathematics videos - one serious, one not so much.

Can you conceptualise 10 dimensions? This could help.


Ever wondered what maths is really about? This is hilarious (well I think so...)

Friday 20 November 2009

Ep 118: Astrobiology and the search for extraterrestrial life

pictures of alien on hillAstrobiology is a fascinating and complex field of science. It is the study of the origin, evolution, distribution, and future of life in the universe, and is a relatively new field of science incorporating astronomy, biology, geology, palaeontology, physics, mathematics and other disciplines. It is even more fascinating given that we have never actually discovered life anywhere else in the universe!

Dr Carol Oliver is a science communication researcher working for the Australian Centre for Astrobioligy, whose key goals include contributing to the understanding of the orgin of life on Earth and to set an Australian life-seeking instrument on the surface of Mars.

I spoke to Carol about astrobiology and the SETI Project - the search for extraterrestrial life. Tune in to the podcast here (or press play below):


We covered a number of topics in our chat including:
  • How does SETI actually look for extraterrestrial life?
    SETI searches for electromagnetic signals from civilizations elsewhere in the universe - but where should they look? It turns out there is a handy hole in the electromagnetic spectrum coined The Water Hole - a band of radio frequencies between 1420 MHz and 1640 MHz. This is the band between the hydrogen line and the strongest hydroxyl spectral line, and is a very quiet region - there is little radio noise from space between these frequencies. It is theorised that alien communications could be found in this range because of its quietness and also because the combination of hydrogen and hydroxyl yields water, something considered vital for life. It is therefore a likely place for other life, which needs water to survive, to try and communicate. 
  • The Fermi Paradox - The Fermi paradox asks the question, if there are other civilisations in the universe, why haven't we seen any evidence of their presence?
  • Where is the best candidate for life in our Solar System? Is it Mars (more likely for microbial life) or perhaps a moon of Jupiter, like Europa? Was there life on Mars at any stage of its history?
  • The concept of panspermia - that life on Earth may have originated elsewhere in the universe before coming to Earth, perhaps on an asteroid;
  • The Kepler mission - this mission uses a space telescope to look for Earth-like planets and was launched in March 2009;
  • The Drake equation - can we predict whether there are other civilisations out there using maths?
You can participate in the search for extraterrestrial life in the SETI@home project. In 1995, David Gedye proposed analysing radio signals from space using a virtual supercomputer composed of large numbers of Internet-connected computers - this is known these days as grid computing. The idea is to use the combination of many networked computers rather than a single supercomputer, and because of the vastness of space, the width of the electromagnetic spectrum and the fine resolution required, there is an awful lot of data to analyse! You can download the software needed at the SETI@home homepage.

Tune in to the podcast here (or press play below):

Thursday 19 November 2009

Swimming with Whales - video from Tonga

A few months back, I spoke to Scott Portelli about his experiences diving with whales in Tonga - see Ep 109: Tongan blowholes and whales. Scott has recently returned from Tonga, and took from breathtaking footage of the whales. Enjoy the video below.

Saturday 31 October 2009

Ep 117: Science of Superheroes - Mystique (X-men)

Ever wondered whether it is scientifically possible to become a superhero?

In a new series of podcasts, Dr Christopher Pettigrew (aka Dr Boob*) and I are going to tackle this question. Chris is a post-doctoral researcher at the Department of Biochemistry in University College Cork, and in these podcast episodes - which we will publish more than a few times a year - we will uncover whether it is possible now to possess the powers of superheroes, and if we can't, whether in the near future we could engineer ourselves to become superheroes.

The first superhero we are tackling is Mystique from X-Men. X-men get their powers from an "X gene" that normal humans do not possess, and Mystique is a shapeshifter who naturally looks blue. Actress Rebecca Romijn portrayed Mystique in the X-Men films - I know I clearly remember the blue body-paint...

Mystique has a number of powers including:
  • The ability to change skin colour;
  • The ability to shape-shift - that is, change form;
  • She can impersonate other voices;
  • She can rapidly grow her hair.
Within nature, chameleons are able to change their skin colour to match their environment. There are also technologies under current development, such as metamaterials, that can be used to make something look invisible. Through a combination of genetic manipulation to activate melanocytes (and possibly chromatophores), and the use of surface coatings, it is not unforeseeable that we could develop human chameleons. The difficulty here lies in whether we can make a skin colour change a conscious decision - how can you wire up the body such that skin colour responds your thoughts?

The challenge of being able to impersonate another person's voice should be easy enough to conquer in the near future through a combination of electronics and simple mimicry. It is also possible to foresee rapid hair growth - this could be accomplished by rapid protein synthesis, such as in spider webs.

The biggest difficulty comes with the shape-shifting - how can one change their 3D shape?

Tune in to the podcast here (or press play below) to discover what scientific techniques we came up with to tackle the problem of scientifically engineering Mystique:


A few extra notes to explain some of the random comments in the show:
Let us know your thoughts on how we could scientifically engineer Mystique. We rated this a 7.5 out of 10 possibly for the next 200 years - if someone really wanted to, notwithstanding the ethical concerns along the way.

Also let us know which superheroes you would be interested in us tackling.

* From here on in, Chris will be referred to as Dr Boob - this nickname stems from the fact that Chris's PhD and some of his post-doctoral work has been into the study of breast cancer - yes, someone who is actually changing the world!

Monday 19 October 2009

Ep 116: Terence Tao and Prime Numbers

Terence Tao is a Professor at the Department of Mathematics, UCLA and one of Australia's most acclaimed mathematicians. Indeed, he is arguably the world's greatest living mathematician. In 2006, he was awarded a Fields Medal, which is the top prize a mathematician can win, and at 24 became the youngest ever full professor at UCLA.

I recently went to Tao's Clay–Mahler Lecturer at UNSW, which was a fascinating look at prime numbers. I managed to grab Terence for a quick chat. Listen to this podcast here:


Primes are integers that can only be divided by themselves and one. For example, the number 10 can be divided by 1, 2, 5 and 10 - whilst the number 11 can only be divided 1 and 11. The first few primes are:

2, 3, 5, 7, 11, 13, 17, 19, 23, 29, 31, 37, 41, 43, 47, 53 ....

One of the interesting things about the primes is that there is no known formula yielding all of them - you can't simply plug a few numbers into a formula to generate a list of the primes. However, on a large scale, their distribution can be modelled. The primes behave as if they are distributed pseudorandomly - see the picture on the right. Each dot in this Ulam spiral represents a prime number - you start in the middle, and wind outwards like a spiral - each dot is a prime, whilst empty space is a non-prime. Whilst you can see various patterns, nothing is predictable.

The prime number theorem says that the probability of a given number n being prime is inversely proportional to its logarithm. Euclid proved that there are infinitely many prime numbers way back in 300BC - see Euclid's Theorem for more. The current largest known prime was discovered in 2008 by the distributed computing project Great Internet Mersenne Prime Search and has 12,978,189 digits:
243,112,609 − 1.
Primes are very important for public-key cryptography - that is, the way your credit card numbers are encrypted in online transactions. The cryptography makes use of the fact that is difficult to factorise large numbers into their prime factors, whilst it is comparatively easy to multiply two large primes together. No efficient integer factorisation algorithm is currently known - in 2005 a 193-digit number was factorised, but it took 5 months.

Terence Tao, along with Ben Green, proved that the sequence of prime numbers contains arbitrarily long arithmetic progressions - this is the Green-Tao theorem. What this means is that for any number k, there is an arithmetic progression of primes k long. An arithmetic progression is one in which the difference between two numbers in the progression is the same. For example, the series 2, 4, 6, 8, 10... is an arithmetic progression with common difference 2. Green and Tao proved that such sequences exist within the primes for any length of series you want. For example, the series 3, 7, 11 is a prime sequence of length 3 with common difference 4. The series 3, 5, 7 is length 3 with common difference 2. The current record is a series of 25 primes.

I have just finished reading the excellent book The Music of the Primes by British author Marcus du Sautoy - I highly recommend it. It details the story of the Riemann hypothesis which is considered by many to be the most important unresolved problem in mathematics. A solution to the Riemann hypothesis could make an immense contribution to our understanding of the distribution of prime numbers. You certainly don't need to be a maths geek to understand this book - it is a great historical tale. You can buy the book from Amazon here.

I chatted to Terence briefly after his talk, but being the amateur journalist I am, my recorder ran out of batteries! Not to fear, I have added an interview Terence did with Australia radio station Triple J's current affair program Hack - this interview has been reproduced with the permission of the executive producer, best brother James West - it's nice to have a proper professional journo in the family! The interviewer is Kate O'Toole. Listen to this podcast here:


God may not play dice with the universe, but something strange is going on with the prime numbers - Paul Erdos

Friday 16 October 2009

Blog Action Day 2009 - Climate Change

October 15 is Blog Action Day 2009 and this year's topic is Climate Change. The idea is to raise awareness of the topic, so I thought I'd get in on the act - it is still October 15 in some parts of the world...

Climate Change is arguably our most pressing human concern. If you are interested in what it is, who’s responsible and why we should care, then an easy way to enter the debate is to have a listen to our 2007 Beer Drinking Scientists episode on the topic. Grab the mp3 here, or listen below:


We recorded this in 2007 over a beer or three, and so some of the more recent discoveries and insights are not included. In the Australian context, John Howard was the Prime Minister and we hadn't signed the Kyoto Protocol. The other Beer Drinking Scientist is the irrepressible Darren Osborne. We took a break from these podcasts when I went overseas and Darren started to breed, but we have plans for the future, stay tuned...

We have talked about climate change a number of times on this blog and on the podcast. To see all our climate change articles, check out the climate change tag. Interesting articles include:
The importance of climate change to humans and to Earth can not be underestimated. Climate Change also featured in our top 10 science stories of 2006, 2007 and 2008. If you have any thoughts on the topic, feel free to share them or participate in Blog Action Day.

Tuesday 29 September 2009

Ep 115 (Enhanced): Dust storms in Sydney

The dust is finally starting to clear from Sydney, leaving a ruddy orange layer of muck all over the city. This podcast goes with our previous article Red Sydney, and as well as being a description of the science involved, is a video slide show of photos of the dust-storm. All the photos in this enhanced podcast come from flickr and are available to use under Creative Commons licences.

Watch the following youtube video, or download the wmv or mp4 versions - mp4 will play on your ipod, wmv is slightly higher quality:


The photos come from the following flickr users (click to see the original photo):
And after you've checked out the above podcast and photo links, have a look at this - this is a video of a couple driving into a dust storm in Broken Hill, NSW. Amazing!

Wednesday 23 September 2009

Red Sydney

Waking this morning was a very eerie experience. Blood-red light peaked through the sides of my blinds, and given I was half asleep at the time, I thought the four horsemen of the apocalypse had come to Earth.

When I shook the haziness from my head and peaked outside, the view was astonishing. Not surprisingly, Twitter had loads of comments and on-the-fly photos, and the TV and radio news broadcasts were full of dust-storm stories.

Dust storms are not uncommon in Australia - indeed, central and eastern Australia are a major global source of atmospheric dust, and this particular storm, estimated to be 600 km long and dumping 75000 tonnes of dust into the Tasman Sea every hour, could be headed to the New Zealand ski-slopes (that'll teach you to beat us at rugby). Dust can travel a very long way in the atmosphere, with dust from Chinese storms found in the French Alps.

The storm has its origins in the Indian and Southern Oceans, where low pressure storms create severe cold fronts. Low pressure air sinks to the ground, forcing hotter, higher pressure air upwards. This can cause thunderstorms, and on Monday, winds of more than 100 km per hour formed in South Australia. As inland Australia is in drought, the winds picked up dust not fixed to the ground by vegetation. The dust likely came from the Lake Ayre Basin, according to ABC Science Online, and has caused the worst pollution ever seen in NSW.

The reddish colour of the sky is an interesting phenomenon. Normally during the day, the sky is blue. This is because of Rayleigh scattering. Shorter wavelength light from the Sun (blue) is scattered by the air in all directions to a greater degree than longer wavelength light (red). The amount of scattering is related to the fourth power of the wavelength - blue light with a wavelength of ~400 nm is scattered about 10 times more efficiently than red light (~ 700 nm). The scattering in this case is mainly due to oxygen and nitrogen molecules smaller than the wavelength of the light.

Due to the scattering of blue, when you look directly at the Sun, you see more of the longer wavelength light, which is why it appears yellow. The rest of the sky is lit by the diffuse scattered blue light. At dawn and dusk, the Sun's light has to travel through more of the atmosphere to get to your eyes as it comes in at a tangent to the Earth (go on, draw it...). This means even more blue is scattered and a larger piece of the sky looks a even deeper red.

Dust particles are quite large compared with oxygen and nitrogen, and so do not scatter light in the same way. Some dust absorbs light more effectively at blue wavelengths than at red wavelengths, meaning that light shone through it will appear more red. Dust also scatters sunlight, but as the particles are large, this scattering is independent of wavelength. This means that the dust particles act something like tiny mirrors, diffusing the light throughout the sky. This is why the red colour was so intense at dawn - as the light that hit the dust was already red due to Rayleigh scattering, it was then scattered throughout the whole sky. Normally at sunrise, the red colour is confined to only a small part of the sky. The presence of dust (and pollution for that matter) can cause beautiful effects. As the sun climbed higher in the sky today, the red colour softened. Eventually the sky just looked a dirty orange - the colour of the iron-rich dirt.

Here are some of my favourite pics from today - the above zombie was found through @ozdj. I received the following Godzilla pic in an email and found it on flickr, but I don't know who the originator is. It is brilliant. None of these images have been manipulated - yes, it was back to the 60s with sepia Sydney today!


From MarchingAnts on flickr:


From TomHide on flickr:


Also see the Red Dust Collection and The Red Sydney Project. More dust storms are predicted for this week, so stay tuned.

Saturday 19 September 2009

A sorry saga - the crumbling cookie

This week saw the publication of a story that "more than half of all Britons have been injured by biscuits."

The story received plenty of coverage in the British national press, and if true, is surely one of the UK’s most pressing Occupational Health and Safety concerns.

Australian’s are culturally similar to Britons, so I asked around the office and found that no one around here had ever been injured by a biscuit. So I thought back to my 18 months in the UK and to my recollection I was never injured by a cookie, and I certainly don’t remember a horribly outrageous and dangerous biscuit-eating culture.

Is biscuit-eating really an extreme sport in the UK?

It's quite hard to know where to start with this article, but it is almost the perfect example of "how not to report science in the newspaper."

We’ll start with the actual reporting before dealing with the science behind the story. The early claim that "more than half of all Britons have been injured by biscuits" is diluted a little in the following paragraphs, in which it becomes "an estimated 25 million adults have been injured while eating during a tea or coffee." Injured while eating during a coffee break covers a lot more than being injured simply by eating a biscuit. But a quick look at the original "scientific report" (see later) mentions nothing about 25 million adults in the UK (roughly half the population) being injured in such a way, nor is it possible that anything in the report could be extrapolated to such a number. The company that conducted this research, Mindlab International, states that their study says nothing about the proportion of people being injured in this way and that they have no idea where the number came from.

The article then goes on to say that "at least 500" people have been hospitalised because of their injuries. This is a slight difference to 25 million, and indeed 500 out of 64 million people in the UK is such a small number that it is hardly worth reporting. You can see where the number 500 comes from by looking at The Home Accident Surveillance System 2002 report.

The next thing to do is look at what constitutes a biscuit-related injury. My favourite hidden biscuit dangers, according to The Telegraph, are:
  • flying fragments,
  • people poking themselves in the eye with a biscuit,
  • falling off a chair reaching for the tin,
  • "one man even ended up stuck in wet concrete after wading in to pick up a stray biscuit,"
  • choking on crumbs,
  • being bitten by a pet or 'other wild animal' whilst trying to get their biscuit.
Heavy hitting stuff!

The article then goes on to rate the dangerous biscuits, using the Biscuit Injury Threat Evaluation Index (BITE Index, get it??). Of course there is no explanation of how these numbers were obtained and what exactly they mean:

Custard Cream 5.64
Cookie 4.34
Choc Biscuit Bar (eg: Rocky) 4.12
Wafer 3.74
Rich Tea 3.45
etc. etc.

It’s at this point you start to wonder why any of this was reported at all. Well, the study was commissioned by Rocky, a type of biscuit made by Fox’s. You’ll note how they are the only example of a biscuit given in the above list – all the rest are generic biscuit types.

What we have here is a perfect example of a company trying to get some publicity by commissioning a pseudo-science study and putting out a press release. Because "science" and "maths" are used in the article, an impression of credibility is given to the story. This is precisely why people say things like "you can prove anything with statistics" and think anyone with an interest in science is either mad, a boffin or has no connection to the real world. It’s ludicrous that this kind of story can make it into the UK national press, and it’s dangerous because it not only gives people the wrong impression of science, but some people might actually believe it! And whatever happened to fact-checking journalists? Are we so short on news that this gets reported as such?

Ben Goldacre has a nice article on how companies use "news" like this to get around advertising rules. It makes me sad that advertising, which at least most of the time we know is advertising, has rules against misinformation but that news articles don’t.

Now to take a look at the actual science behind the story, and it’s about as good as the reporting. Needless to say that the survey data used to create the mathematical BITE formula is not publicly available, but this is no surprise. It should not surprise anyone that the report is not peer reviewed or published anywhere credible, but let’s not set our hopes too high here. You can find the report on the Rocky site. Let’s also ignore the bit that says the research is independent, and skip to the fact that:

"The study, supervised by Mindlab International Ltd scientists, involved ten students aged 16 -18 to investigate the physical properties of biscuits."

So this report was done by high-school students?

Here is the final BITE equation:


Pretty isn’t it? Looks complicated, it must be correct. One of the weird things about this report is that every equation looks to have been scanned in from somewhere else – not that this influences how we analyse it, but it doesn’t look very professional.

There are two parts to this equation: biscuit dependent and consumer dependent factors. Biscuit dependent means the factors that are derived from biscuit behaviour, and consumer dependent means the factors found through survey data – these are not given or explained.

Six possible injuries from biscuit-eating have been named:
  • Eye/ear/trachea irritation caused by crumbs.
  • Scalding – due to splashes caused when a piece of dunked biscuit falls into hot liquid.
  • Back Injury, hernia, muscular problems from picking up dropped biscuit pieces.
  • TMJ (temporomandiular joint) syndrome to jaw by frequent biscuit chewing.
  • Workplace injury due to being distracted by the sound of biscuits being broken.
  • Dental Damage due to biting on a hard biscuit or something within the biscuit, such as a nut or piece of hard chocolate.

Have a read over them again… TMJ (temporomandiular joint) syndrome to jaw by frequent biscuit chewing....

Going on a bear hunt does an excellent review of the whole sorry saga, including a look at the role of Mindlab International – the blog lists its "favourite plausible fudge factors, false assumptions and downright crazinesses" - check them out for a good laugh.

These are my favourite two:
  • A breaking biscuit has a noise level of between 5 - 15dB. This is apparently loud enough to cause injury through distraction in the workplace. A typical whisper is 20dB - rustling leaves are around 10dB. I would estimate that my generally quiet workplace operates with about 35dB of background noise, and if I have my ipod on, then that's probably about 60dB (louder when I turn on angry music and read reports like this one).
  • The report models a crumb getting in your ear as equally likely as getting in your eye. This seems a bit like the famous Seinfeld spitting incident – the crumb would have to rise upwards from where the biscuit is broken, then curve back around into the ear. That’s one magic luggie crumb.
I love their statement:

For obvious safety reasons, laboratory work did not involve trials in which vulnerable body parts were repeatedly impacted by biscuit crumbs!

Careful of those deadly crumbs!

Private funding of scientific research is very important – plenty of good, independent science is done this way. But this particular example is just ridiculous! Mindlab is part of the Sussex University Innovation Centre and so presumably should be above this kind of nonsense. They say:

Our unique research methodology combines hard neuroscience and sophisticated mathematical analysis to provide reliable and timely answers of immediate practical benefit.

Given that the survey data was given to them by the company that commissioned them to produce the research, that rather spurious analysis was done by high school students, and that there is absolutely no practical importance in this work, I think they pretty much failed their own mission statement.

This kind of thing is fine for generating an interactive tool for a biscuit website – indeed it is fun – but let’s not dress this up as science or news.

Monday 14 September 2009

Ep 114: The Science of Coffee

Following on the heels of our Science of Cocktails podcast, we have an episode for the morning after – The Science of Coffee.

At the recent Science of Coffee event at Lushbucket Cafe as part of The Ultimo Science Festival, I spoke to Rafael Bartkowski from Campos Coffee about the scientific method of making coffee, the most important steps in the process, how to decaffeinate coffee and where in the world you can find the best cup.

Listen to this podcast here:


To go with the podcast, here is a quick description of how Campos Coffee decaffeinates their coffee.

Swiss Water Decaffeination
Campos uses the Swiss Water Process. This method does not use organic solvents, and so is claimed to be better for you. To perform the decaffeination, the first step is to soak green coffee beans in hot water. This releases the caffeine, as well as other soluble compounds within the beans. These other compounds contribute strongly to the taste of coffee – let’s call them “flavour compounds” - and so these particular beans must be discarded. The water solution now contains caffeine and flavour compounds. Caffeine is then stripped from this solution by means of activated carbon filters (see below for a brief description of this process).

With the caffeine now stripped from the water solution, we are left with a solution of flavour compounds – this solution becomes “flavour-charged” (the company’s description, not mine!) A new batch of green beans is then soaked in the flavour-charged solution, releasing caffeine but less of its flavour-compounds, as the solution is becoming saturated. This solution is again decaffeinated by a carbon filter, and new beans are added. This process is repeated until the flavour-charged solution is saturated with flavour-compounds, but crucially not caffeine as the caffeine is stripped from the solution after each soaking. After a number of repeats, no flavour-compounds are released by the green beans - only caffeine is released. This leaves us with (almost) decaffeinated beans that can be roasted to make coffee. It is impossible to completely decaffeinate the coffee.

Given that the world’s only Swiss Water decaffeination facility is based in Canada and so therefore the beans must be transported large distances – especially when bringing them to Australia – the process does not seem very energy efficient. Presumably, a lot of water is also used. There are various online debates as to whether this is the most sustainable process for coffee decaffeination.

Read here and here for more on decaffeination.

Carbon Filtering
Carbon filtering uses activated carbon, which is a form of carbon (usually derived from charcoal) that is extremely porous. This gives it a very large surface area, which can adsorb contaminants in the water. Note that adsorption is different to absorption. Adsorption is the bonding of material onto the surface of another material by intermolecular forces – that is, it gets stuck on the surface. Absorption is the incorporation of one substance into another – that is, one substance penetrates the interior of the other.

One gram of activated carbon has a surface area around 500 m2, and this incredible surface area means that a large amount of contaminant material can accumulate on the surface. Carbon filters are good at pulling organic compounds like caffeine out of water. As the flavour-compounds are also organic, the carbon filters used here need to be caffeine specific. To do this, the carbon filter is coated in a caffeine-specific solvent layer. According to patent 4324840, this coating could consist of petroleum oils, triglycerides, fatty acids, fatty alcohols and other water-immiscible materials. This is dissolved up in hexane, which is then piped through the carbon-filter. The hexane, being volatile, then evaporates away leaving the filter coated in a caffeine-specific adsorption layer. When you think about it, it's hardly chemical free!

Monday 7 September 2009

Ep 113: The science of cocktails

Manuel Terron is a celebrity chef with the Lifestyle Channel program Mixing with the Best - he is described as a Mixologist, writer and bar consultant, and has been working in the bar/cocktail industry for 17 years. He's also described as sultry and I know my better half certainly had an eye on him....

Manuel ran an event called The Science of Cocktails during the Ultimo Science Festival. It was a fantastic event, and apart from learning how to make margaritas and martinis, Manuel took us on the cocktail making journey, explaining why making cocktails has far more to do with the scientific method than it does a random artistic process. He also explained why some drinks pick you up (tequila), others make you angry (rum), and some can clear the mind (absinthe) - as well as the science of mixology - why some alcohols mix well and other's don't. This is largely due to the interplay of the various tastes (sweet, sour, bitter, salt, umami) and the smell of the drink.
And what exactly is a molecular cocktail?

To find out more, have a listen to my chat with Manuel after the event. A couple of cocktails makes for a very smooth interview!
Listen to this podcast here:


Read more on the event over at 10daysofscience.

Thursday 3 September 2009

Stats in the media

I love to see statistics in the media. This week there were a couple of stories that caught my eye:

Town hall bans staff from using Facebook after they each waste 572 hours in ONE month.

I found this article courtesy of the excellent science blog, The Lay Scientist. On first reading that headline from The UK's The Daily Mail, it would seem that 572 hours is an extremely large amount of time for one person to spend on Facebook in one month. The article says that over the last year, the 4500 employees of Portsmouth City Council have spent on average 413 hours a month on Facebook while at work, peaking at 572. If we assume there are 30 working days a month (that is, the employees are very keen and work weekends), this means on average they spend almost 14 hours a day on Facebook. Each!

If we look a little more carefully and assume a 40-hour week and a 22-working-day month, this comes to 180 working hours, well below the 413 Facebook average! The problem of course is the word EACH in the title, and The Daily Mail has since removed it from the online story. If we remove the offending word, as The Lay Scientist has done, we can see that the average employee with Portsmouth City Council staff spends 20.8 seconds using Facebook each day. If anything I think the council should be commended!

This would be an example of some bad stats (or more to the point, bad arithmetic). 

League's bad boys might just be acting their age, statistics suggest

The Sydney Morning Hearld published an interesting article on the recent spate of off-field incidents by Australian Rugby League players. 2009 has been a horror year for League, with new players seemingly in trouble with the law every week. The article used data from NSW Bureau of Crime Statistics and Research to compare the rate at which players are charged with assault, with the prevailing rate for all males aged 18 to 34 in NSW. They found that across the state, young men are charged with assault at a rate of about 700 per 100,000 each year - you can look this up yourself on the NSW Bureau of Crime Statistics and Research website, although I couldn't find it split by age. In the 12 months to March 31, out of the 400 players who play in the NRL, only three were charged with assault. The article then suggests that this rate of 750 per 100,000 is only slightly above the NSW figure and so therefore League players really aren't that bad.

The biggest problem with this statistic is sample size, which the article itself concedes. You can't draw too many conclusions when the addition of only a couple more assaults would double the NRL assault rate - to prove a significant difference between two data sets, you need to have a large sample size. With a small sample size and a very low assault rate, even if the assault rates look similar, you can't conclusively say very much.

The other problems include the fact that the data doesn't look at the year post March 31 - which has been the NRL's annus horribilis - except for a passing reference that it looks like it could be a bad year for the NRL given that three players have already been charged with assault and there are seven months left till next March. The data also does not take into account that many of the crimes NRL players have committed are not assault but fall into other categories.

However, the article concedes all this - so why was it published? Despite the fact that the word "statistics" has been used in the headline to add weight to the argument, the correct interpretation of these particular statistics is to say that very little has been proven. If you sampled your local gaol or down-town Johannesburg, a sample size of 400 for a crime that usually has a very low rate might prove significant, but that's not the case here. Perhaps we have proven that the NRL is better than a bunch of criminals - I guess that's something!

The issue here is that people remember the headline. Even though the article was entirely correct in what it said - it mentioned all the statistical concessions we've listed here, and even put the word "might" in the headline - readers will remember that "statistics showed" that League players are just like you and I. I posted about a similar topic a couple of years back when The Independent on Sunday presented a graph of the oil price between 2000 and 2008, and on the same chart plotted the Nasdaq technology index between 1992 and 2000. The two plots showed a startling similarity, even though they are completely unrelated and even though the article conceded this point very early. However, at first glance you are mislead, and this is what people remember - I somewhat cheekily plotted the performance of the Australian cricket team on the same chart to make this point - it was an even better correlation!

You can draw your own conclusions on the behaviour of League players. Of course, wikipedia has a list of off-field incidents involving league players for you to peruse!

Edit: I thought it worth taking a look at some of the stats - using a 2-tailed t test, with a sample size of 400, if 9 players committed assault in a year, then you could say that NRL players are more likely to commit assault than the general public. This corresponds to a rate of 2250 per 100,000 - three times what we had before. This could essentially be a big night out for NRL players at the end of the season! What this suggests is that a small difference can make a big result, and this is why we can't draw too many conclusions about League behaviour from this data. If there were a pool of 4000 NRL players, you could start to draw conclusions on NRL behaviour if 40 committed assault - this is a rate of 1000 per 100,000 - considerably less than the case for a pool of 400. It is dangerous to quote "rates" when you don't have much data.

The other point is that failing to show that two data sets are significantly different - that is, that NRL players are no different to the state as a whole - doesn't mean that they are the same. As we have seen, when only a few more assaults would make a very large difference, the system is not very stable.

Flying Spaghetti Monster appearance in Tonga

Over here we are devotees of The Church of the Flying Spaghetti Monster, if for no other reason than His brilliant insight that global warming, earthquakes, hurricanes, and other natural disasters are a direct result of the shrinking number of Pirates since the 1800s. We are proud to dedicate our regular Correlation of the week to this observation, and on my recent trip to Tonga, He showed me that He is pleased with our work.

On walking through a cemetery in the Tongan capital Nuku'alofa, I spotted the following dedication to His Noodliness. Whilst Christianity is by far the major religion in Tonga, there seems to be evidence that the FSM church is working with both Christianity and the traditional culture, and growing in the South Pacific - the very place that global warming and rising sea-levels will have the biggest effect, and therefore the greatest need for pirates.


Then during the night I awoke and managed to snap this quick photo as He appeared to me from our fale roof. You can clearly see His glory shining through.


I like to think He is happy with our spreading of His word through Correlation of the week.

Sunday 30 August 2009

Ep 112: Jon Lomberg, the Voyager Gold Record, and the movie Contact

Jon Lomberg is one of the world's most distinguished space-artists. Lomberg was Carl Sagan's principal artistic collaborator for more than twenty years and in 1998, the International Astronomical Union officially named Asteroid Lomberg in his honour.

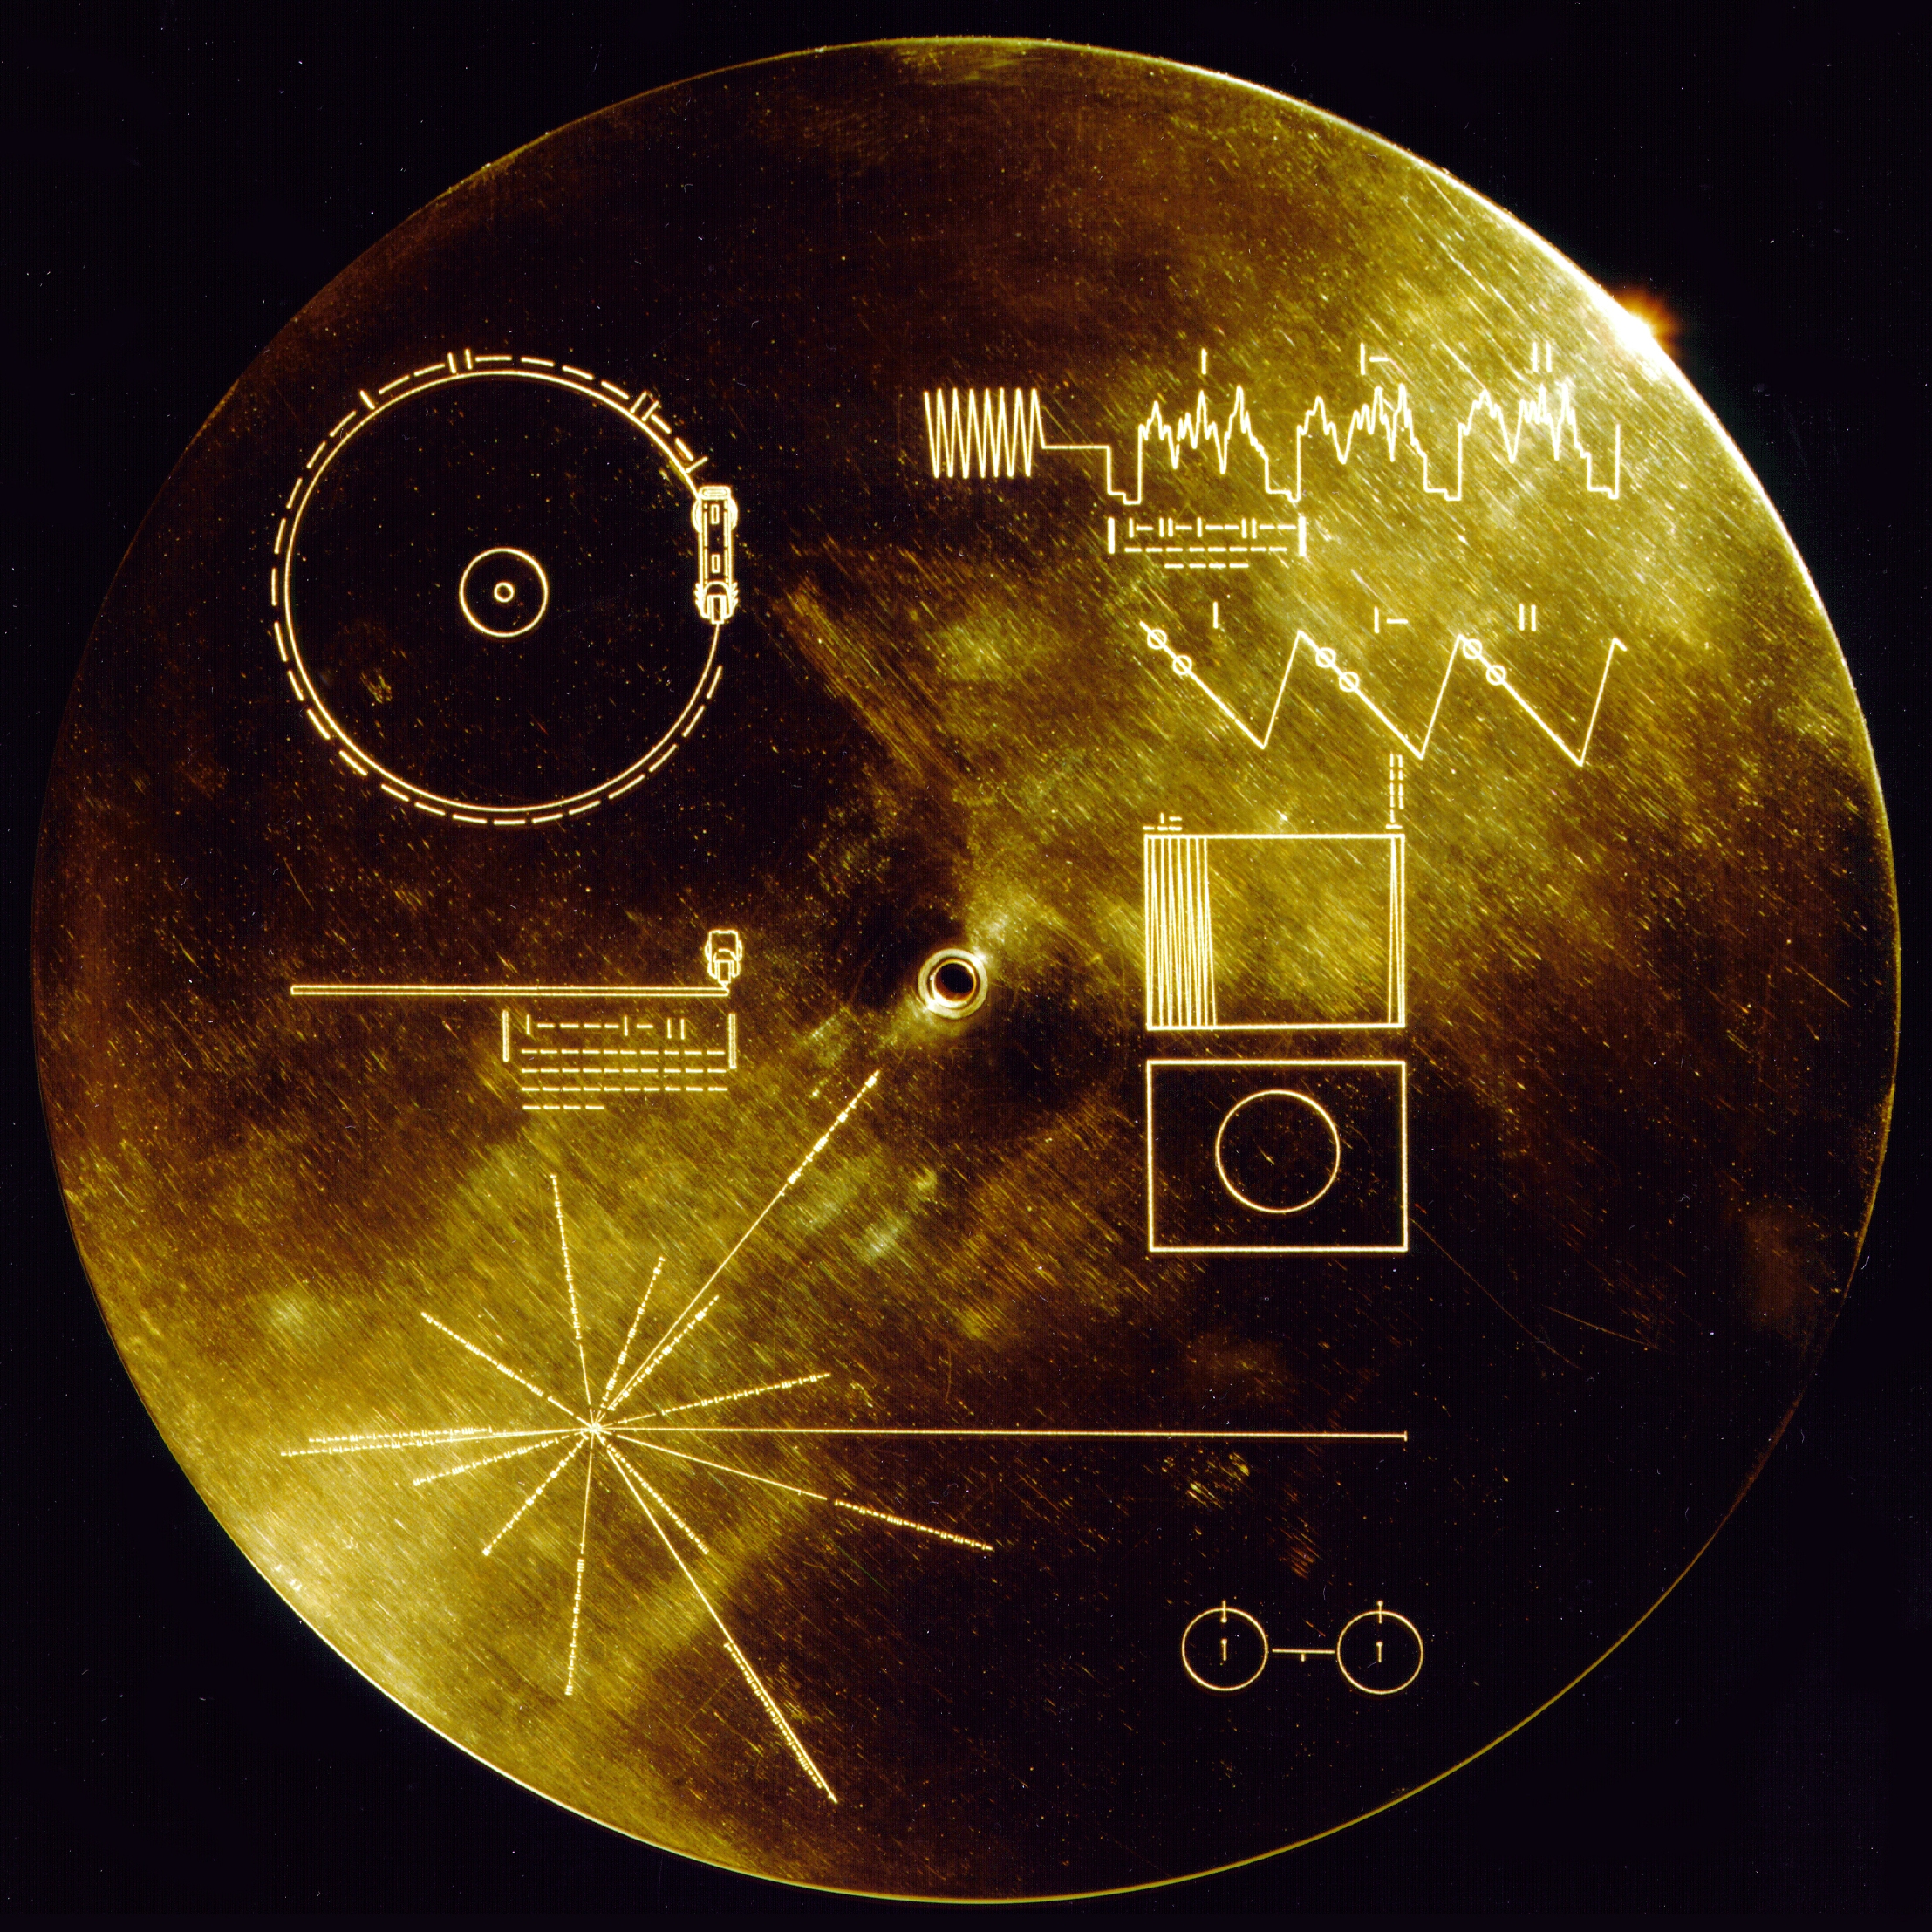
In 1972, Sagan asked Lomberg to illustrate The Cosmic Connection, after which they worked on NASA's interstellar Voyager Golden Record, a record included in the two 1977 Voyager spacecraft. It contains sounds and images that portray the various life forms and cultures on Earth. The record is intended for any intelligent extraterrestrial life that may find it. It also contains information about our mathematics and science, as well as a way of decoding the record. As aliens may not see colours as we do, if they see at all, a method of decoding the information was included in the spacecraft, as well as an explanation of mathematics from its most simplistic level - one dot means the number one, two dots mean two, etc. From this point you can denote addition, multiplication and so on. The Voyager spacecraft are not heading towards any particular star, and Lomberg thinks that as the craft are unlikely to crash into a planet, if they are spotted, it will be by alien life that has mastered interstellar travel.

Lomberg also designed the original cover art for Sagan's novel Contact, and the opening sequence for the Contact film. Lomberg gave a talk at the Ultimo Science Festival and I was lucky enough to grab him for a chat afterwards. Listen to this podcast here:


For some more information on Jon, check out his website and have a read of the 10daysofscience story of his recent meeting with 1999 Young Australian of the Year, astronomer Professor Bryan Gaensler. This is a lovely story - Gaensler just happened to be sitting next to Lomberg at the Eureka Awards, and also had a tutorial scheduled for the next day on the challenges of portraying science and astronomy in film, using Contact as his primary example. Naturally, Gaensler asked Lomberg, “What are you doing at noon tomorrow?” See the 10daysofscience story for more information and videos from the tutorial.

To get you in the mood, here is the opening sequence for the movie Contact (on youtube here if you can't see the embed). It takes the journey of a spacecraft starting at Earth and hearing the sounds that Earth is currently pumping out into the Universe in the form of radio waves. As we pan out from Earth and journey further and further away, we hear older and older sounds to represent the idea that the sounds broadcast by the first radios are still travelling through the Universe - the further away we go, the older the music sounds, until we have left the solar system, and then the galaxy.

Saturday 22 August 2009

Ep 111: The Ultimo Science Festival, and sending text messages to aliens

This week's podcast celebrates the start of the Ultimo Science Festival - ten days and nights of science fun for families, schools, and people of all ages. The festival is presented by the Powerhouse Museum, the Australian Broadcasting Corporation, The University of Technology Sydney and TAFE NSW. It runs mainly in the Ultimo precinct near Central Station and Harris St - see the map on Google maps here. Most events are free and held from Friday August 21 through to Sunday August 30, 2009.
In this show, I chat to Festival Director Tilly Boleyn about how the festival started, what to expect, and what fun can be had. Some of the events we chatted about include Why the mind matters, The Dark Side of Science, Mathematics and Sex, The Science of Cocktails, and The Science of Coffee. I also chat to Jacqui Hayes from Cosmos Magazine about the Hello From Earth project. The project collects text messages on its website to send to Gliese 581d which is an exoplanet, or extrasolar planet, which means it is in orbit around a star other than the Sun. The Gliese 581 system is thought to be one of the best candidates for life outside our Solar System of the more than 350 systems with exoplanets so far discovered.

Listen to this podcast here:


After message collection closes on Monday 24 August 2009 - hurry!! - all the messages will be collected as a text file and sent to NASA's Jet Propulsion Laboratory, where it will be encoded into binary code. This system of beeps and pauses will be sent back to the Canberra Deep Space Communication Complex at Tidbinbilla, near Canberra. The signal will reach the solar system of Gliese 581 around December 2029 having travelled 20.3 light-years (192 trillion km). The soonest we could hope to receive an answer is in 42 years time in 2051. For more on the technical details, check out the Hello From Earth homepage. And check out the following youtube video:


To read more on National Science Week and the Ultimo Science Festival, see our recent blog post on the topic. Hope to see you at the Festival!

Friday 21 August 2009

The Open Laboratory: The Best Writing on Science Blogs 2009 - Nominations Open

Nominations for the 2009 anthology of the best writing on science blogs, The Open Laboratory 2009, are now open. Last year there were around 830 submissions narrowed down to 50 essays, one poem and one cartoon. You can buy the 2006, 2007 and 2008 editions at Lulu.com.

If you would like to nominate blogs for this year's edition (and please feel free to nominate posts from this blog, please.....), use this submission form to submit original poems, art, cartoons and comics, as well as essays and blog posts.

Last year I was lucky enough to make the cut with a post I wrote for Plus Magazine called United Kingdom - Nil Points about the maths of the Eurovision Song Contest. Amusingly, as the title is a bit of an in-joke for Eurovision fans, the name of the article was changed to Political Music for US audiences!

And please remember to only nominate articles that would look good in a book - don't nominate podcasts, posts with embedded video etc. There are other awards for these types of things. Follow A Blog Around the Clock for more.

Thursday 20 August 2009

National Science Week Australia

National Science Week is Australia’s largest festival, celebrating science, innovation, mathematics, engineering and technology. Held annually in August, and now in its twelfth year, National Science Week welcomes an audience of over a million and hosts more than 800 events across the nation. According to a Newspoll survey, more than half the Australian population is familiar with the festival. (I am a little sceptical about this fact, although as it is such a wonderful occasion for science communicators, I'll let it slide!)

This year the festival runs from 15 to 23 August. Events take place in every Australian State and Territory, with the majority free and open to the public, offering an opportunity for all Australians to get involved.

There is also the very funky sounding National Tour. With events held in every State and Territory, the Tour guests help to inspire and motivate Australians about science and raise the profile of science within the community. This year, the National Tour will be joined by NASA Astronaut Marsha Ivins; environmentalist Tanya Ha; theoretical physicist Lawrence Krauss; and palaeontologist Scott Sampson.

If you'd like to find out what's going on in your neck of the woods, check out the National Science Week website.

If you are in Sydney, then you'll want to be getting over to the Ultimo Science Festival, which runs from Friday 21st August to Sunday 30th August. I will blog and podcast more about this event very soon - I have interviewed the organisers, now to edit it all into a show... In the meantime, check out their website and look out for me at the festival. There are loads of events, but the ones I plan to go to include:
So, with any luck, I'll be dosed up on caffeine, cocktails and sex. Good times ahead!

And if blogs are more your thing, then check out the 10daysofscience site as they blog their way through the festival. I'm sure I will be twittering throughout so stay tuned for more blogs, podcasts and tweets.

Tuesday 11 August 2009

This makes me want to count!

If it were possible that Feist could get any cuter, here it is. In this clip, she sings her song 1234 with the cast of Sesame Street. Brilliant - surely this will get the next generation into mathematics!


Oh why not, here's one more! This is Sesame Street's take on Bruce Springsteen's Born to Run - in this case, Born to Add!

Thursday 6 August 2009

Ep 110: Coral, the Stone Henge of the Pacific, and more of the sights, sounds and science of Tonga

This week's podcast takes us back across the ocean to discover more of the sights, sounds and science of Tonga - see our previous episode for more on Tongan blowholes and whales.

On location in Tonga, we tackle the topics of:
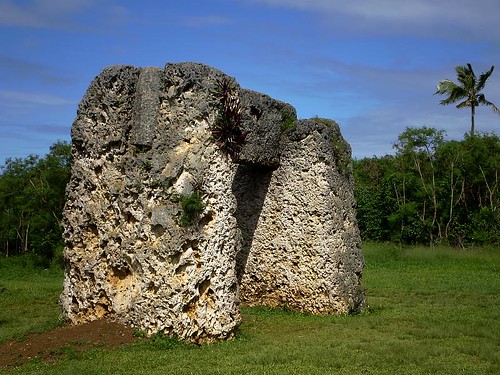
  1. Haʻamonga ʻa Maui - otherwise known as The Stone Henge of the Pacific. This is an ancient 12-tonne stone trilithon whose purpose is not exactly known, much like that other Stone Henge in the UK. A previous King of Tonga, Tāufaʻāhau Tupou IV, once claimed it had an astronomical significance as it can determine the position of sunrise at solstices and equinoxes. As it was said by the King, it is the accepted explanation for what is an odd stone construction, at least in Tonga anyway.
  2. How did people get to Tonga in the first place? The generally accepted history is that the Lapita people came down through Papua New Guinea into Melanesia and Polynesia. However, Norwegian explorer Thor Heyerdahl had other ideas based on the fact that the sweet potato (kumera) is found in both South America and Polynesia. To prove that it was at least possible that Tongans came from South America, in 1947 he sailed the Kon-Tiki raft across the Pacific Ocean from Peru to Tuamotus. Heyerdahl showed that, by using only the materials and technologies available at the time, there were no technical issues that prevented South Americans coming to Polynesia. Whilst the evidence suggests that people came through South East Asia and Papua New Guinea to reach the Pacific, one school of thought suggests that Polynesians may indeed have travelled to South America and picked up the kumera from there.
Back here in Australia, I spoke to Lachlan Whatmore about coral - what is it, how does it form, and what life does it support. Lachlan is a diving enthusiast and the golden tonsils of Australian community radio - as well as a qualified Marine Biologist. In short, coral is an Anthozoan marine organism that lives in colonies of polyps. Corals build reefs in tropical oceans - the reefs are made up of their calcium carbonate skeletons. Listen in for more.

And tacked onto the end of this show, we have a Correlation of the Week - this week discussing the relationship between eclipses and the stock market - see our previous story on the topic for more.

Listen to this podcast here:


Stay tuned for our final edition on Tonga in a few weeks.

Thursday 30 July 2009

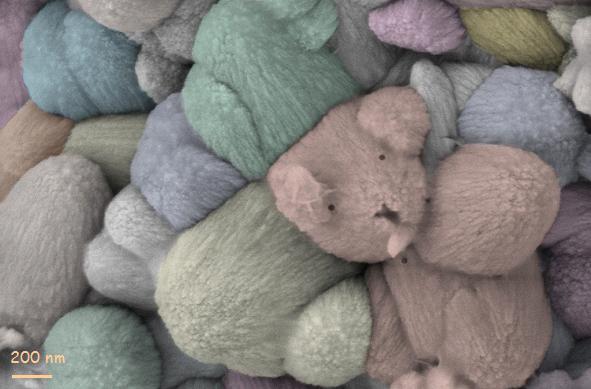
Nano Teddy!


1stplaceHeliaJalili
Originally uploaded by rodolfobernal
I love this pic from flickr. It is a scanning electron microscope image of Zinc Oxide (ZnO) nanostructures (that is, really small ZnO structures) on indium oxide coated glass.

I'm not sure if it is a chance photo, or one deliberately created, but either way it is cool!

Scanning electron microscopes create images by scanning a surface with a beam of high-energy electrons. The electrons interact with the atoms that make up the sample, and this interaction produces various signals from which a sample's surface topography can be recreated. The interactions between the electron beam and the sample can give off x-rays or light, it can also cause the electron beam to be scattered, and small currents can be generated in the sample. These signals can be read by sensitive equipment which can then reconstruct what the surface looks like.

See this "Science as Art" competition for more funky science photos!