If you listened to the crowd at a
Waratahs (Rugby Union) game, apart from wondering which side the so-called fans were barracking for, you'd think that the Waratahs kicked the ball too much. If you have ever listened to a Rugby League fan wax lyrical about how Union teams keep kicking the ball away and how League teams know how to cross the try line, you might start to become convinced that Union teams really do kick too much. But as we like to do here, let's put these popular notions to the test. Is there really more kicking in Union than League?
The question originated at my work, where most Mondays - indeed most days of the week - we debate the relative merits of the two rugby codes. So if for no other reason than to prove my own hunch, I compiled the data for the current season of the Australian
National Rugby League (after round 12) and the three nation
Super Rugby (after round 15) tournaments. The following chart shows the distribution of the number of times each game a team kicks the ball.

We can conclude:
- This year in the NRL, each team averages 19.05 kicks per game. In Super Rugby, each team averages 19.07 kicks per game - there is essentially no difference between the average number of kicks in a Union game and a League game in 2011. The difference of 0.02 is well below what we need for statistical significance;
- Both sets of data look pretty-much bell shaped - that is, they are close to normal distributions (probably as a result of the Central Limit Theorem). The League distribution is thin and tall - there is only a small distribution about the mean (standard deviation of 3.8) - whilst the Union distribution is fatter (standard deviation of 6.2). This suggests that in a League game, most of the time teams will kick somewhere near this average number of times (19), whilst in a Union game you are more likely to see a game with not many kicks or a game with a lot of kicks. This is a result of the fact that in League, after the 5th tackle, you don't have many other options but to kick, whilst in Union, with an unlimited tackle count and continual contest for the ball, you have more options for when and how often you wish to kick.
- The notion that it's the boring teams that kick too much take another hit when you look at the teams who actually do kick the most. The Reds, lauded this year for playing running rugby, are top of the kick table, whilst the Brumbies, who can't beat anyone, are stuck at the bottom of the kick and Super Rugby tables. In the NRL, the top three kicking teams are 3 of the top teams in the competition. Check out Green and Gold Rugby for more on the Super Rugby kicking stats.
| Super 15 | | | NRL | |
|---|
| Reds | 23.8 | | Dragons | 21.9 |
| Waratahs | 22.8 | | Storm | 20.6 |
| Cheetahs | 21.1 | | Broncos | 20.5 |
| Rebels | 20.7 | | Eels | 20.4 |
| Stormers | 20.1 | | Sea Eagles | 20.2 |
| Bulls | 19.9 | | Warriors | 19.4 |
| Sharks | 18.9 | | Raiders | 19.4 |
| Force | 18.7 | | Rabbitohs | 19.4 |
| Blues | 18.6 | | Sharks | 19.2 |
| Chiefs | 18.6 | | Knights | 19.2 |
| Crusaders | 17.4 | | Cowboys | 18.6 |
| Hurricanes | 17.2 | | Panthers | 18.2 |
| Lions | 16.5 | | Bulldogs | 18.2 |
| Highlanders | 16.4 | | Titans | 17.7 |
| Brumbies | 14.5 | | Roosters | 16.5 |
| | | Wests Tigers | 15.6 |
- I find it fascinating that the averages come out so close. It's over 100 years since the codes split from their common ancestor, and despite numerous law changes and evolutionary paths, teams in League and Union seem to want to hold onto the ball, on average, for about the same amount of time. In league, you are limited to 6 tackles, so could it be that the law-makers of League, when devising the 6 tackle rule, knew instinctively that this is the right balance of attack and defence? Does this balance give the players just the right amount of rest during a game? Or is it all a coincidence?
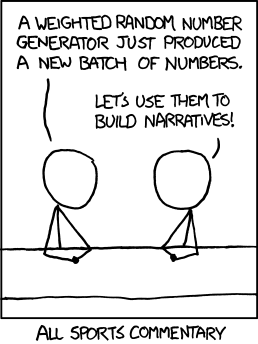
And while we're on the topic of maths and sport, it's important when doing statistical analysis on sport that you analyse the right thing and take note of statistical significance. Despite the popular saying, statistics don't lie, but poor use and interpretation of them does. I think this
comic from xkcd sums up how I feel when I listen to ex-professional sportsmen commentating on sport...

With regards to cricket, we have
shown here on the blog that a batsman's cricketing scores over his career fit the exponential distribution very well, suggesting that many notions of cricketing form, and discussions of it, are quite troublesome - that is, it's not form creating the fluctuations in a batsman's career, but the very nature of the game itself. Deep.
Kicking images courtesy State of Union address - Tom Bradshaw's rugby blog. Yes I support the Waratahs and believe wholeheartedly that Rugby Union is a much better game than League. And unlike other Waratahs fans, I think they're actually pretty good!


