
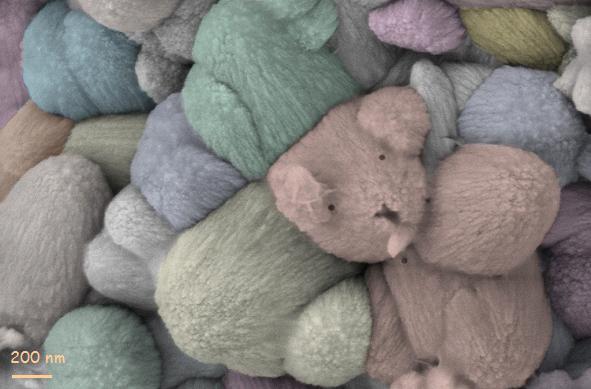
I love this pic from flickr. It is a scanning electron microscope image of Zinc Oxide (ZnO) nanostructures (that is, really small ZnO structures) on indium oxide coated glass.
I'm not sure if it is a chance photo, or one deliberately created, but either way it is cool!
Scanning electron microscopes create images by scanning a surface with a beam of high-energy electrons. The electrons interact with the atoms that make up the sample, and this interaction produces various signals from which a sample's surface topography can be recreated. The interactions between the electron beam and the sample can give off x-rays or light, it can also cause the electron beam to be scattered, and small currents can be generated in the sample. These signals can be read by sensitive equipment which can then reconstruct what the surface looks like.
See this "Science as Art" competition for more funky science photos!
Thursday, 30 July 2009

Wednesday, 29 July 2009
Distracted Driving and Cut-throat Capitalism
Here are a few games that are fun and sciencey to keep you sane at work.
The New York Times recently published a Distracted Driver game to gauge your distraction while you're texting on the road. The game puts you driving on a road having to negotiate a number of toll booths along the way. The game tests your ability to drive through the correct gates without any distractions, and then it makes you write a couple of text messages whilst still having to negotiate the booths.
Piracy has a romantic history often associated with walking-the-plank, peg-legs and saying Arrrrr a lot - there is even an international talk like a pirate day on the 19th of September each year. However, modern piracy in Somalia is a deadly game and nothing like the stereotype. Nevertheless, Wired Magazine has had some fun with this and brings us Cut-throat Capitalism in which you are a pirate commander staked with $50,000 from local tribal leaders and other investors, and your job is to guide your pirate crew through raids in and around the Gulf of Aden, attack and capture a ship, and successfully negotiate a ransom.
 The game is addictive and highly strategic. Initially I kept alienating my crew by being nice in my negotiations, so they eventually deposed me as captain. Then when I was too tough on my hostages, the Navy was called in. Eventually, I was successful in negotiating a $3 million ransom.
 Piracy off the Somalian coast is seen as a business by those who conduct it, and as such it can be analysed by economists (who, in general, love to think that the world revolves on an economic axis). Wired has taken a look at the economics of piracy and found that the typical payoff for piracy in Somalia today is 100 times what it was in 2005. One of the reasons why it is flourishing today is because it exploits the incentives that drive international maritime trade. Shippers, insurance companies, private security contractors, and national navies stand to lose less by tolerating it rather than attempting to stop it - insurance covers the ransom, ships and goods are not lost and no one dies. The pirates know that they can keep escalating the situation to see just how much the "market" can bear. The negotiation process also involves risk/reward calculations.
Driving whilst Distracted
The New York Times recently published a Distracted Driver game to gauge your distraction while you're texting on the road. The game puts you driving on a road having to negotiate a number of toll booths along the way. The game tests your ability to drive through the correct gates without any distractions, and then it makes you write a couple of text messages whilst still having to negotiate the booths.

After you finish the game, you get a comparison of your result with everyone else who has played. I improved the second time I played, my first results are below. I didn't see a grey lady either time!

- The Dutch national road safety research institute (SWOV). Their publication SWOV Fact sheet: Use of mobile phone while driving was published in 2008 and contains a great deal of up-to-date research. Their conclusion is that the negative effects of mobile phone use whilst driving are caused by both physical and cognitive distraction. Although physical distraction can be reduced through the use of such aids as handsfree phones and speed dialling, cognitive distraction remains the crucial problem. They conclude that handsfree phones do not have significant safety advantages over handheld phones. They also point towards research suggesting that talking on a mobile phone is associated with cognitive distraction that may undermine pedestrian safety.
- Applied Cognition Laboratory, Department of Psychology, University of Utah - David Strayer has published a wealth of research on the impact of using in-car technologies on driving performance and traffic safety. It is well worth a browse of their published articles.
Cut-throat Capitalism
Piracy has a romantic history often associated with walking-the-plank, peg-legs and saying Arrrrr a lot - there is even an international talk like a pirate day on the 19th of September each year. However, modern piracy in Somalia is a deadly game and nothing like the stereotype. Nevertheless, Wired Magazine has had some fun with this and brings us Cut-throat Capitalism in which you are a pirate commander staked with $50,000 from local tribal leaders and other investors, and your job is to guide your pirate crew through raids in and around the Gulf of Aden, attack and capture a ship, and successfully negotiate a ransom.
The game is addictive and highly strategic. Initially I kept alienating my crew by being nice in my negotiations, so they eventually deposed me as captain. Then when I was too tough on my hostages, the Navy was called in. Eventually, I was successful in negotiating a $3 million ransom.Piracy off the Somalian coast is seen as a business by those who conduct it, and as such it can be analysed by economists (who, in general, love to think that the world revolves on an economic axis). Wired has taken a look at the economics of piracy and found that the typical payoff for piracy in Somalia today is 100 times what it was in 2005. One of the reasons why it is flourishing today is because it exploits the incentives that drive international maritime trade. Shippers, insurance companies, private security contractors, and national navies stand to lose less by tolerating it rather than attempting to stop it - insurance covers the ransom, ships and goods are not lost and no one dies. The pirates know that they can keep escalating the situation to see just how much the "market" can bear. The negotiation process also involves risk/reward calculations.
Friday, 24 July 2009
Correlation of the Week: Eclipses and the economy
 In the paper Dark Omens in the Sky: Do Superstitious Beliefs Affect Investment Decisions?, Gabriele Lepori from Copenhagen Business School has correlated the occurrence of solar and lunar eclipses with four American stock indices: the Dow Jones Industrial Average, the S&P 500, the New York Stock Exchange Composite, and the Dow Jones Composite Average.
This is possibly the most fun, and most mathematically rigorous, Correlation of the Week we have had. I love it!
Lepori's idea was to test whether superstitious practises could be picked up in the stock-market. His theory was that individuals are more likely to resort to superstitious practices when operating in environments dominated by uncertainty and high stakes. The stock market is therefore an ideal place to test this theory.
Eclipses are regarded as "unlucky" in many Western and Asian societies, and as they are worldwide events occurring over a short period of time, the effects of such unlucky events should be seen in stock trading - if there is an effect, that is.
Lepori took the dates of all 362 lunar and solar eclipses that had been visible anywhere in the world between 1928 and 2008, and computed the four stock indicies on the day of the eclipse. The results suggest that in the three days around the date of an eclipse, three of the four stock indices exhibited statistically significant lower-than-average returns. If an eclipse took place on a weekday (when the stockmarkets were open), its effect was larger than if it occurred on a weekend. And the greater the magnitude of the eclipse, the more likely it would influence stock returns!
On the days following the eclipse, Lepori showed that markets reverse the eclipse-related dip, suggesting that the market realised the drop was irrational. Here is a perfect opportunity for astute investors to make some money - buy stocks at the eclipse maximum and sell a few days later! Or sell a few days before the eclipse and buy back at its maximum. This is known as arbitrage. Indeed, Lepori found that an investor who had bought the Dow Jones Industrial Average at the end of 1928 would have multiplied their money 37 times by now. However, one who sold before each eclipse and bought back straight after would have multiplied their money by 55.
Lepori's theory is consistent with the idea that at the time of an eclipse, there is less buying pressure coming from the superstitious. Trading volume also decreases. These patterns are inconsistent with Efficient Market Theory, which states that traded assets reflect all known information, and instantly change to reflect new information. This means that it is impossible to consistently outperform the market by using any information that the market already knows - eclipses are perfectly predictable events and so even if they did influence stock prices, this should already be built into the price.
I recommend a read of the original paper - check out the mathematical rigour and the lengths to which Lepori went to control for other variables such as day of the week, media coverage of the eclipse and even the weather! Fantastic stuff!
I'm not sure whether this gives me a more positive or negative opinion of the stock market. On one hand, it shows how complex the market is and why we must employ smart people (and pay them loads) to understand it. On the other hand, this study shows that completely irrational beliefs and behaviours can influence how we price things. This surely undermines the system. In the modern globalised world, everything is governed by finance, and allowing irrational thought to influence world affairs scares me! But maybe that shouldn't surprise me - wars are started over personal disagreements, politics is dominated by petty arguments and some people still doubt evolution - I guess the world just ain't rational!
Sunday, 19 July 2009
Ep 109: Tongan blowholes and whales
 The Kingdom of Tonga is an archipelago in the South Pacific Ocean comprising 169 islands stretching over a distance of about 800 kilometres. It is the only sovereign monarchy in the Pacific and takes pride in its claim that it was never colonised.
I recently spent a wonderful two weeks in Tonga - the islands completely live up to their billing as the Friendly Islands - Captain Cook gave Tonga this moniker after his first visit in 1773 when he was treated to various festivals. It was only later that it was revealed local chiefs wanted to kill Cook but could not agree whether to attack by day or night.
This is the first in a series of podcasts about Tonga that include my own recordings from Tonga and also interviews with experts in the scientific areas we tackle. In this show, we look at:
- The Mapu a Vaea blowholes - these blowholes are created by the ocean pounding into the coastal rock and moving through natural tunnels creating a fountain;
- Tongan singing - not much science here, but it's beautiful!
- Whale behaviour and migration - I chat to Scott Portelli, an award winning photographer and diver who runs whale-watching tours in Tonga. Scott recently won the prestigious Scuba Diver AustralAsia - Through the Lens Underwater Photography Competition with an outstanding photo from Tonga - see more of Scott's photos on his webpage. Scott runs Swimming with Gentle Giants, a company which conducts whale diving tours each year between August and October off the islands of Vava'u in northern Tonga. I chat to Scott about:
- his experiences swimming with whales,
- when to swim with whales,
- whale behaviour and migration patterns,
- the oceanic animals of Tonga,
- a little bit of whaling politics,
- the threats to whales, including whaling, global warming and pollution, and
- the fact that I once ate whale...
Stay tuned for more on Tonga in upcoming podcasts, in which we will talk about, and experience, the intoxicating drink Kava, the Stone-Henge of the South Pacific, the effects of global warming and rising sea-levels on Tonga, the local animals and more on whaling science and politics.
Listen to this podcast here:
And see below for some very cool traditional dance (also here if you can't see the video):
Thursday, 9 July 2009
Who do you trust to build your synchrotron?
I love this clip of former Australian cricket Damien Fleming on the comedy show Thank God You're Here, the Australian theatre-sports style show which essentially aims to embarrass celebrities. In this challenge, as Australian sportsmen tend to talk a lot about things they don't know, Fleming was set the challenge of marketing the Australian Synchrotron. His opening line, "choosing the right sub-atomic particle analysis facility is a little bit like medium pace bowling" is brilliant. Check it out below or on the youtube video:
Wednesday, 8 July 2009
Science survival guide for The Ashes

Ashes backyard cricket
Originally uploaded by westius.
Here is our science survival guide to the Ashes:
- Ashes success and El Nino
- How to rank cricketers
- Science, Psychology and Cricket
- The curse of the duck
- Science, Cricket, Fitness and Psychology
- Sex before Sport?
- Economists, oil, cricket and correlation
Is the winner of The Ashes already pre-determined? Manoj Joshi has shown that the El Nino Southern Oscillation (ENSO) phenomenon has a significant effect on the results of The Ashes cricket series when the series is held in Australia. The Australian Cricket team is more likely to succeed after El Nino years, while the English cricket team does better following La Nina years (the opposite phase). Their study, Could El Niño Southern Oscillation affect the results of the Ashes series in Australia? was published in the journal Weather.
For many people, including me, cricket isn't just a sport, it is a way of life.
These words could easily have come from me, but are actually the words of Rob Eastaway, a cricket-loving mathematician from the UK, and originator of the official International Cricket Council cricket-ratings which rank not only teams, but players within each team. In this podcast, I chat to Rob about how you mathematically rank cricketers.
Every cricket season, the TV coverage of cricket becomes more spectacular and technological, with the introduction of microphones to detect the finest of edges through to the keeper, improved abilities to determine the trajectory of a ball once it has left the bowler’s hand, and now even heat sensors to see how the batsman sweats.
But the scientific aspects of cricket are not limited to TV companies, with science playing an increasing role in shaping the performance of players, from their general fitness to specific training techniques for both their physical, and possibly more importantly mental, well-being. It is with science that countries are aiming to find the competitive edge.
The recent news of the great Indian batsman Sachin Tendulkar surpassing West Indian Brian Lara's record number of test runs has given maths-loving cricket geeks another opportunity to pull out their calculators and Excel spreadsheets. At the time of writing, Tendulkar had scored 12,027 runs across 247 innings, to overtake Lara's 11,953 from 232 innings. After a little investigation, I found that despite his outstanding average of over 54 runs per innings, Tendulkar's most common score in test cricket is ... zero! Even the great Don Bradman scored a duck more times than any other score. And their next most common? One! We look at how are cricket scores are distributed.
Do you need to be fit to play cricket? Do the best batsmen in the world really have the ability to predict the type of ball they will receive before it even arrives? And is cricket really more of a mental game than a physical one?
In this podcast episode, we talk to Dr Rob Duffield from the School of Human Movement at Charles Sturt University who has found that indeed you really do not need to be as physically fit to play cricket as you do other sports such as football. We also chat to Dr Allistair McRobert from Liverpool John Moores University whose work has shown that the best batsmen can predict to some extent where a bowler will bowl. This work encompasses a look into the subconscious mental game of cricket and how the most successful players are more mentally prepared for the top level than lesser players. More on this topic can also be found in our article The Science of Cricket.
It is the virile sports-person's eternal question - should one abstain from a little bit of nookie before a big sporting event? If I was Michael Clarke and engaged to Lara Bingle, I wouldn't be...
Can we predict cricket results using the price of oil? Or is this just bad stats. Also see our article Poor correlations, or why it's not the fault of Aussie cricketers.
Good luck to all and come on you Aussies!
Sunday, 5 July 2009
Ep 108: Correlations of the week - vampires and zombies vs. presidents, cricket vs. the weather
This week on the podcast we tackle two Correlations of the week published recently here on The Mr Science Show:
- Do the number of Vampire and Zombie movies released each year depend on whether the US president is Republican or Democrat?
- Is the winner of the Ashes cricket series between Australia and England dependant on the El Nino effect?
Tuesday, 30 June 2009
Correlation of the Week: Ashes success and El Nino
As we have shown on this blog a number of times (see here, here and here for starters), cricket fans love their maths. So it should come as no surprise that another cricket/maths story has recently come out, this time from the University of Reading linking cricket success with the weather! I only blog my maths/cricket geekiness, these guys have research funding!
Manoj Joshi has shown that the El Nino Southern Oscillation (ENSO) phenomenon has a significant effect on the results of The Ashes cricket series between Australia and England when the series is held in Australia. The Australian Cricket team is more likely to succeed after El Nino years, while the English cricket team does better following La Nina years (the opposite phase). Their study, Could El Niño Southern Oscillation affect the results of the Ashes series in Australia? was published in the journal Weather.
I didn't quite believe this at first, so I took their data, redid the maths, and it turns out that they are correct! However, the media interpretations of these results are not surprisingly a little over the top. Whilst there is a significant correlation between the state of El Nino in the year before the Ashes series and the result, the correlation itself is weak. This is an important point to keep in mind with any correlation - strength and significance are two different things - even sciencedaily got this wrong in its reporting on the topic. There is a nice explanation of these ideas here.
Strength refers to how well the data sets move with each other, significance refers to how likely it is the correlation occurred by chance. For example, you can easily get a strong correlation between two data sets if you have only a small amount of data. But as you lack data, it is unlikely that the relationship will actually be significant. In our case however, the correlation is quite weak, but the relationship is significant. The conclusion to this study should be that ENSO plays a very small role in determining the results of Ashes series in Australia, but that other factors are likely to be more important, and that simple noise and randomness will probably have more of an effect than the phase of ENSO. It is only over time that this correlation can be teased out. The study does admit this, with Joshi saying:
"There are of course many different factors governing the outcome of any given sporting contest, which would act as noise in this analysis."
But I think his statement that "the study could even influence whether the England touring team should include more fast bowlers or more 'swing' bowlers" is probably a little bold (and to his credit he does admit this)!
So, how does this all work?
There are two phases of ENSO - during El Nino, the eastern equatorial Pacific Ocean warms by about 1 degree. For Australia this means low rainfall and high temperatures. La Nina is a reverse, with more rain and a drop in temperature. The study analysed the results of all Ashes matches held in Australia from 1882-2007 and found that during El Nino years, the Australian team won 13 out of 17 series (76%), but only five out of the 13 played in La Nina years (38%). England has only won one Ashes series in the last 100 years following an El Nino event - the Bodyline series in 1932/33. The author speculates that cricket pitch conditions can affect the outcome of a match with the drier pitches of El Nino favouring fast Australian bowlers with the English slower swing bowlers enjoying La Nina.
Now to the maths. I have reproduced the results from the paper in our chart as you can see here. On the y-axis is the series result (English wins minus Australian wins). On the x-axis is the Nino 3 index, which is the mean monthly temperature anomaly in the eastern tropical Pacific: 5S-5N; 150W-90W. Of course, all the dots should be on integer values of y - some were shifted in the original paper for ease of viewing. The correlation is still correct.

What we can see here is a very weak correlation - the R2 value is only 0.1. R2 is the coefficient of determination and gives some information about goodness of fit. A value this low is generally accepted as suggesting no correlation at all. One interpretation is to say that about 10% of the correlation can be explained by the Nino 3 index. The paper itself quotes R (=-0.31) as opposed to R2, but to determine whether a relationship is strong or not, you need R2.
To test for significance, Joshi generated 10000 sets of randomly generated numbers to represent the Nino 3 index - each set had 32 members (the same number as the number of Ashes series) and a normal distribution with a mean of zero and a standard deviation of 0.8, similar to ENSO observations. They found that the chance of R being more negative than -0.31 was 5%, which is the level generally accepted as being significant.
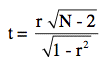
There is, however, an easier way to do this - you can use t-tests (as we used in our earlier Correlation of the Week on vampire and zombie movies). To generate your t-statistic, you use the formula:
Manoj Joshi has shown that the El Nino Southern Oscillation (ENSO) phenomenon has a significant effect on the results of The Ashes cricket series between Australia and England when the series is held in Australia. The Australian Cricket team is more likely to succeed after El Nino years, while the English cricket team does better following La Nina years (the opposite phase). Their study, Could El Niño Southern Oscillation affect the results of the Ashes series in Australia? was published in the journal Weather.
I didn't quite believe this at first, so I took their data, redid the maths, and it turns out that they are correct! However, the media interpretations of these results are not surprisingly a little over the top. Whilst there is a significant correlation between the state of El Nino in the year before the Ashes series and the result, the correlation itself is weak. This is an important point to keep in mind with any correlation - strength and significance are two different things - even sciencedaily got this wrong in its reporting on the topic. There is a nice explanation of these ideas here.
Strength refers to how well the data sets move with each other, significance refers to how likely it is the correlation occurred by chance. For example, you can easily get a strong correlation between two data sets if you have only a small amount of data. But as you lack data, it is unlikely that the relationship will actually be significant. In our case however, the correlation is quite weak, but the relationship is significant. The conclusion to this study should be that ENSO plays a very small role in determining the results of Ashes series in Australia, but that other factors are likely to be more important, and that simple noise and randomness will probably have more of an effect than the phase of ENSO. It is only over time that this correlation can be teased out. The study does admit this, with Joshi saying:
"There are of course many different factors governing the outcome of any given sporting contest, which would act as noise in this analysis."
But I think his statement that "the study could even influence whether the England touring team should include more fast bowlers or more 'swing' bowlers" is probably a little bold (and to his credit he does admit this)!
So, how does this all work?
There are two phases of ENSO - during El Nino, the eastern equatorial Pacific Ocean warms by about 1 degree. For Australia this means low rainfall and high temperatures. La Nina is a reverse, with more rain and a drop in temperature. The study analysed the results of all Ashes matches held in Australia from 1882-2007 and found that during El Nino years, the Australian team won 13 out of 17 series (76%), but only five out of the 13 played in La Nina years (38%). England has only won one Ashes series in the last 100 years following an El Nino event - the Bodyline series in 1932/33. The author speculates that cricket pitch conditions can affect the outcome of a match with the drier pitches of El Nino favouring fast Australian bowlers with the English slower swing bowlers enjoying La Nina.
Now to the maths. I have reproduced the results from the paper in our chart as you can see here. On the y-axis is the series result (English wins minus Australian wins). On the x-axis is the Nino 3 index, which is the mean monthly temperature anomaly in the eastern tropical Pacific: 5S-5N; 150W-90W. Of course, all the dots should be on integer values of y - some were shifted in the original paper for ease of viewing. The correlation is still correct.
What we can see here is a very weak correlation - the R2 value is only 0.1. R2 is the coefficient of determination and gives some information about goodness of fit. A value this low is generally accepted as suggesting no correlation at all. One interpretation is to say that about 10% of the correlation can be explained by the Nino 3 index. The paper itself quotes R (=-0.31) as opposed to R2, but to determine whether a relationship is strong or not, you need R2.
To test for significance, Joshi generated 10000 sets of randomly generated numbers to represent the Nino 3 index - each set had 32 members (the same number as the number of Ashes series) and a normal distribution with a mean of zero and a standard deviation of 0.8, similar to ENSO observations. They found that the chance of R being more negative than -0.31 was 5%, which is the level generally accepted as being significant.
There is, however, an easier way to do this - you can use t-tests (as we used in our earlier Correlation of the Week on vampire and zombie movies). To generate your t-statistic, you use the formula:
where N is the number of sample points (32). When you do this, you get a t value of -1.78. This means that if our null-hypothesis is r=0 (that is, there is no correlation), when you look this t-value up in a t-distribution table, you find that it is more negative than the critical value of -1.70 in a one-tailed test, which means it is significant. What all this means is that there is a very weak significant correlation very close to zero. I wouldn't put any money on either team based on this result! In any case, Australia is going to win....
Monday, 29 June 2009
Beauty and the Geek comes to Australia
 Ever seen the American show Beauty and the Geek, produced by twitterer, actor and producer Ashton Kutcher? The show takes a bunch of horribly awkward, socially inept, level-23 dragon overlords - sorry, Dungeons and Dragons aficionados - and puts them in a house with a group of stunning looking, but generally slow-on-the-uptake, girls to see what happens. Each geek is teamed up with a beauty and they live together in a room throughout the show, with challenges in each episode being used to eliminate the couples. The challenges test what the contestants are bad at - the beauties are tested in academic topics (the geeks are supposed to tutor them) and the geeks are tested with social questions (the beauties are likewise supposed to teach them about the real world). At the end of the show, one couple wins a swag of money and there is a very American resolution with the contestants saying how much they've learnt and grown.
So yes, it's ridiculous and patronising - but it's compelling viewing and coming to Australia!
If you want to apply to be a contestant on the show, download the application forms on the Channel 7 Beauty and the Geek website.
Thursday, 25 June 2009
Awesome Illusion
This illusion has been doing the rounds this week (see Bad Astronomy and Richard Wiseman for a couple of science blogs I like that picked it up), but it's so good I thought it needed to be posted here also.
Look carefully at the image below. Do you see a couple of spirals, one blue and one green? Well, take a closer look - in actual fact, the blue and green are actually the same colour!

Don't believe me? Copy the image and open it up in PhotoShop or Paint and take a closer look....
You will notice that the orange curves move through the "green" spirals, but not the blue. And the purple curves don't move through the green.
 If we blow this picture up even more, we can see that the colours are becoming more and more similar.
 The blue and green appear to be different colours because our brain works out colours by comparing them to other surrounding colours and it does a bit of mixing. When we look at the "blue" spiral, we also take in the purple curves moving through it. This makes it look more blue. When we look at the "green" spiral, we take in the orange curves, which makes it look more green.
I know that's not a great explanation, so I'd be happy to hear a better one!
Edit by westius 2/7/09: If you doubt this illusion, check out this image - I've replaced some of the colours - you can clearly see now that the 'blue' and 'green' are the same:

Look carefully at the image below. Do you see a couple of spirals, one blue and one green? Well, take a closer look - in actual fact, the blue and green are actually the same colour!
Don't believe me? Copy the image and open it up in PhotoShop or Paint and take a closer look....
You will notice that the orange curves move through the "green" spirals, but not the blue. And the purple curves don't move through the green.
 If we blow this picture up even more, we can see that the colours are becoming more and more similar.
 The blue and green appear to be different colours because our brain works out colours by comparing them to other surrounding colours and it does a bit of mixing. When we look at the "blue" spiral, we also take in the purple curves moving through it. This makes it look more blue. When we look at the "green" spiral, we take in the orange curves, which makes it look more green.
I know that's not a great explanation, so I'd be happy to hear a better one!
Edit by westius 2/7/09: If you doubt this illusion, check out this image - I've replaced some of the colours - you can clearly see now that the 'blue' and 'green' are the same:
Wednesday, 24 June 2009
Furthering your science communication education
 Interested in science communication? Love travelling? Then joining the 2010 Shell Questacon Science Circus might be for you. Their slogan this year is "Got your science degree, now get your backpack!"
If you are a recent science or technology graduate and enjoy science communication, then you can earn a prestigious Graduate Diploma from ANU, work with Questacon, the National Science and Technology Centre, and travel Australia communicating science in cities, towns, outback stations, indigenous communities, schools, nursing homes, just about everywhere. As far as I can tell, there aren't any science communication courses like this anywhere in the world.
Your fees are paid for, and you also receive an additional scholarship. You are trained in science communication from top scientists, journos, radio presenters and performers.
I did the course in 2001 and it was fantastic. To get in, you'll need to be as good looking as these folk and this lot. Not only have I now seen places in Australia that barely anyone gets to see, but I had a ball and made contacts in science communication fields. Plus, you are on tour much of the year and believe it or not, when you aren't, Canberra is a pretty good place to live.
Applications close 31 August - see the circus website for more information.
For my reflections on the 2001 year, see my Science Circus flickr photo set (I really should scan some more photos and put them up - ah, a time before digital cameras were popular...) and this ridiculous story and podcast - if you're game, listen to the podcast of that episode to hear me sing... I have improved my sound recording since then, but not my singing.
If you happen to be at the other end of your science communication post-grad education, the Public Communication of Science and Technology Network is collecting information about PhD theses completed since 2000 on topics in science communication and closely related areas. This
information, with a classification by topic area and country, will be published on their web site and a review will be presented at PCST11 conference in 2010.
This exercise is intended to provide an overview of current and recent research in the growing field of science communication that will support those starting in the field. It is also intended to promote networking between researchers in science communication.
Information is sought on doctoral theses that addressed mainly or exclusively topics such as science in media, public communication by scientists and scientific institutions, history of popularisation, science museums and science centres, science festivals and events, public consultation in science-related policy, risk communication on science-related issues, and so on.
For each thesis, they seek the following details:
- Title;
- author;
- affiliation (university or similar);
- date of completion;
- supervisor(s);
- examiner(s);
- abstract (approx 250 words);
- where accessible (online or print).
And if you do have a science communication PhD, make sure you dance it!
Sunday, 14 June 2009
Sumo vs Chess - how their ranking systems work
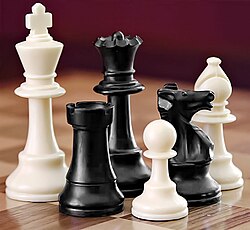 At the very heart of sport is a fierce battle in which the combatants strive to outwit and outplay each other. Each thrust is matched by a parry and in the end, there can only be one winner. The rules of each sport dictate how that winner is determined, and, whether it is football, tennis, golf or chess, it is those who perform best on the day who take home the glory.
But it's not easy to get to the all-important final. True sporting supremacy cannot be decided in a one-off winner-takes-all event. Indeed, many championships are specifically designed such that the ultimate winners are not decided by the results of single events but rather by accumulated results over time. It is easy to rank teams within structured leagues like the English Premiere League, as each team plays all opponents, so that eventually the best teams rise to the top. But it is not always that easy — indeed, more often than not, it is very difficult. Keeping with the football example, how can we compare international football teams such as Australia and England who very rarely play each other? International football sides do not play as often as club teams, so we can't have the same confidence that the team with the most wins over a year, or even the highest percentage of wins, is the best team in the world. And how can we determine which wins are the most important?
Different sports have developed their own way of dealing with the subtleties of ranking their players and teams, and this article is the first of a series looking at these ranking systems. In future instalments we'll be looking at rugby, football, cricket, tennis and golf, but to start off, we explore the ranking systems of two very different sports: chess and sumo wrestling.
ChessIt should not surprise anyone that, of all sports, chess has the most mathematically elegant ranking system — it is, of course, a very cerebral pursuit. The ranking system, called the ELO system, was developed by Arpad Elo, a Hungarian-born American physics professor and chess guru.
Unlike in other sports such as tennis, where rating points can be awarded subjectively — for example, an important tennis tournament might be worth ten times more than another — Elo's idea was to mathematically estimate, based on observation, actual player ability.
 Elo's original assumption was that a player's performance varies from game to game in a way that can be described by the normal distribution: if you measure a player's skill numerically and then plot the number of times he or she has achieved at each skill value against the possible skill values, you will get a bell-shaped curve as shown in figure 1. The peak of the curve is the mean of the distribution and represents the player's true skill, while the tails represent untypically good or bad performances. So while a player can have very good and very bad days, on average they perform somewhere near their mean value. The aim of the ELO system is to estimate the mean value for each player by looking at how often they win, lose and draw against other players with different abilities — this gives you their rating. We can use the player ratings to predict the probability of one player beating another, and the smaller your chance of winning, the more rating points you get if you do win.
Elo's original model used normal distributions of player ability, however observations have shown that chess performance is probably not normally distributed — weaker players actually have a greater winning chance than Elo's original model predicted. Therefore, the modern ELO system is based on the logistic distribution which gives the lower rated player a greater, and more accurate, chance of winning.
To see how this system works in practice, let's have a closer look at the maths. Each player's ability is modelled as having a standard deviation of 200 rating points. The standard deviation is a measure of the spread of the data around the mean. In our case a low standard deviation would mean that the player's performance never strays far off the mean, while a high standard deviation means that he or she occasionally has pretty drastic off-days, both in the negative and positive sense. Traditionally in chess, ability categories like grand master, master and so on, spanned 200 rating points each, and this may be the reason why the value 200 was chosen for the standard deviation.
Based on these assumptions it's possible to work out the expected scores of a player  playing against player
 . If player has a rating of
 and player has a rating of
 , the exact formula for the expected score of player is
 |
Similarly, the expected score for player is
 |
The following chart shows the probabilities involved in a game of chess based on Elo's original normal distribution, and the modified version employing the logistic model. The horizontal axis measures the difference between the rating of player A and player B and the vertical axis gives the chance of a win for player A. There is little difference between the two curves except in the tails, where the logistic curve gives the lower rated player a greater chance of winning.

Player ratings are updated at the end of each tournament. Imagine you are a player with rating 1784. In a tournament you play 5 games with the following results:
- Win against player rated 2314;
- Lose against player rated 1700;
- Draw against player rated 1302;
- Win against player rated 1492;
- Lose against player rated 1927.
As you had two wins and a draw, you scored 2.5. However, your expected score, as calculated from the above formula, was 0.045 + 0.619 + 0.941 + 0.843 + 0.306 = 2.754. Therefore you didn't do as well as was expected.
When a player’s tournament score is better than the expected score, the ELO system adjusts the player’s ranking upward. Similarly when a player’s tournament scores is less than the expected score, the rating is adjusted downward. Supposing player  was expected to score
 points but actually scored
 points, their new rating
 is
 |
where  is a constant which causes much debate in the chess world. Some chess tournaments use
 for masters players and
 for weaker players. This means that unusually good or bad performances weigh more heavily for weak players than they do for masters.
For our player with rating 1784, the new rating becomes
 |
As with all ranking systems, there are controversies surrounding the ELO system. These include
- Mixing: Like all ranking systems, the ELO system works best when players play often against many different people. Imagine a chess club whose members generally play among themselves. Their ratings therefore reflect how good each member is compared to their club's other members. But if that club then plays against a second club in a tournament, there is every chance that one of the clubs is considerably stronger than the other. This however will not be reflected in the ratings before competition. Only after some time will the ratings reflect player ability across both clubs rather than just within each club.
- Initial score: How should a new player be ranked, and how credible is that rank?
- The constant K: What is the right value of K? If K is too low, it is harder to win points, but if K is too high the system becomes too sensitive.
- Selective play: In order to maintain their rankings, players may selectively play weaker players.
- Time: How should a player who is not playing anymore, or plays infrequently, be ranked?
Sumo
Sumo masters are decided in a way that's hard to quantify.The ranking method of sumo wrestling is almost the complete opposite of chess — much like the sports themselves! Whilst some mathematics feeds into the ranking formulation, much of what determines a sumo's rank, especially in the upper ranks, cannot be quantified.
There are six divisions in sumo wrestling — makuuchi, juryo, makushita, sandanme, jonidan and jonokuchi. The top division, makuuchi, is very popular in Japan and has a complex inner ranking system, with yokozuna the ultimate rank. The following figure shows the breakdown of sumo ranks, with the numbers in brackets representing the number of wrestlers at that level.

Sumo wrestlers fight in tournaments called basho. These tournaments run to 15 days and depending on the division consist of seven or 15 bouts. Grand Sumo tournaments, known as honbasho, determine sumo rankings and there are six throughout the year. In these tournaments, the wrestlers fight within their divisions — sekitori fight 15 matches whilst the lower divisions fight seven. As there are more wrestlers than there are matches, sumo elders called oyakata determine the match-ups the day before.
 In general, rising to sekiwake, the third level of the highest division, requires that you win more bouts than you lose in tournaments. If you have a positive winning record in a tournament, you will move up, and vice versa. If your winning record is 13-2, you will climb higher than someone with an 8-7 record.
The jump from the third division, makushita, to the second division, juryo, is perhaps the most important rank distinction in sumo. Juryo is the first rank of sekitori, and the ultimate aim of most wrestlers. Wrestlers lower than this rank have to do chores for their superiors and are essentially sumo slaves. Non-sekitori wrestlers become tsukebito (personal valets) for the higher ranked wrestlers. Those at the very top of the table, yokozuna, typically have four tsukebito while everyone else in the sekitori class normally has two or three depending on prestige and seniority. There is probably no other sport in which the difference between ranks is so important — tsukebito need to accompany their superiors wherever they go, and while sekitori can relax and hang out with their fan clubs at the end of the day, or go home to their apartments, the junior wrestlers must clean the sumo stables and live in communal dormitories. The difference in salary is also huge — juryo rank receives a base salary of ¥1,036,000 (around £7,000) plus considerable add-ons and bonuses, while there is no salary below this rank.
Given this massive discrepancy, you can see why maintaining a rank of sekitori is very important for a sumo wrestler. Indeed, the ancient sport has recently been tainted by a match fixing controversy. A study by Steven Levitt and Mark Duggan in the book Freakonomics showed that 80% of wrestlers with 7-7 records win their matches at the end of tournaments, when you would expect this percentage to be closer to 50%. The authors conclude that those who already have 8 wins collude with those who are 7-7 and let them win, since they have already secured their ranking.
The rank of yokozuna is the highest and most venerable position in the sumo world. The yokozuna is the Grand Champion. Ozeki are also held in very high regard, and there are always at least two ozeki — there is no minimum on the number of yokozuna at any one time, however there may be none. There are currently two yokozuna.
To achieve these ranks, you must do more than have a positive honbasho record. By the time a wrestler reaches the rank of sekiwake, he has been able to maintain a positive honbasho record for some time. If a sekiwake starts to accumulate 10-5 or better records and occasionally upsets a yokozuna, the sumo administrative board (called the sumo kyokai) will consider a promotion to ozeki. One of the benefits of ozeki is that there is no automatic demotion based on match results — to be demoted back to sekiwake requires two consecutive losing streaks.
 If an ozeki starts winning honbasho, he may be judged by the promotion council (the yokozuna shingi iinkai) for possible further promotion. And here is where the real mysteries of sumo ranking come in. The promotion council can recommend the ozeki to the riji-kai (board of directors) of the sumo kyokai. The first thing they consider are the previous three honbasho. Out of those 45 bouts, 38 is the minimum number of wins needed to be considered and the ozeki should have won two consecutive tournaments — but this is not all! The wrestlers must show respect for the sumo kyokai's rule and tradition, and towards past wrestlers, and also possess a character and attitude appropriate for a yokozuna. They must have hinkaku (dignity and grace) and have mastered basic sumo techniques such as shiko (the way a sumo holds his foot aloft before pounded it into the ground) and suri-ashi (the technique of keeping the bottom of each foot always touching the ground while moving). Once the riji-kai approves the promotion, it needs to be finally decided by the banzuke hensei kaigi (ranking arranging committee).
Famously in 1991, Hawaiian-born Samoan wrestler Konishiki, the heaviest wrestler ever in top-flight sumo, was denied yokozuna even though he had won two championships in a row. The chairman of the promotion council said, "We wanted to make doubly sure that Konishiki is worthy to be a grand champion. Therefore, we decided to wait for another tournament." It was speculated at the time that a foreign-born sumo wrestler could never make yokozuna as they could not possess the required cultural understanding. Since then however, there have been foreign-born yokozuna.
A yokozuna cannot be demoted and is expected to retire if his performance starts to dip.
As you can see, mathematics hardly comes into sumo, rather the rankings are based on trust and veneration for those in charge. Most other sports, however, do require a more objective evaluation of their stars, and we'll have a look at some of them in future articles of this series.
For more, see Plus Magazine. For more on chess, see Chess rankings, ChessBase and Knowledgerush, and for Sumo see the Sumo FAQ.
Thursday, 4 June 2009
Ep 107: Ranking Cricketers
 Cricket is one of the world's most statistical sports, and mathematicians in cricket-loving nations love nothing more than delving into the minutiae of the numbers and diving into averages, strike-rates and custom-made measures of batting and bowling effectiveness.
For many people, including me, cricket isn't just a sport, it is a way of life.
These words could easily have come from me, but are actually the words of Rob Eastaway, a cricket-loving mathematician from the UK, and originator of the official International Cricket Council cricket-ratings which rank not only teams, but players within each team. In this week's podcast, I chat to Rob about how you mathematically rank cricketers.
Listen to this podcast here - note a few audio issues, see below:
Ranking individual batsmen and bowlers is no small task. A common method of comparing batsmen is their average, which is the average score the batsman compiles each time he comes in to bat. This method, however, has a number of issues as it does not take into consideration the opposition, playing conditions and how recently the runs were scored. How can you compare a score of 60 against a world-class opponent on a dodgy pitch with a score of 150 against a lowly rated team in easy batting conditions? This is what Eastaway's ranking system attempts to do - and the maths is quite difficult (far more difficult, in Rob's words, than the Duckworth-Lewis method of determining the winner in a rain-effected game!) As well as taking into consideration the strength of the opposition and playing conditions, the ranking system places a greater emphasis on recent performances. The overall system has a number of feed-back loops - the individual player ratings contribute to a team's rating, which effects how many rating points an opposition player can earn against that team - remember, a score of 50 against tough opposition will be worth more than 50 against low-class opponents. Similarly, how each player in a match performs influences how many points are on offer. For example, a score of 45 out of an overall team score of 100 will be more highly valued than a score of 45 out of 450. As such, large amounts of historical data are used to come up with the final numbers. Limited overs cricket has the additional dimension of strike-rate - a batsman who scores his runs quickly will be rated more highly than a slow scorer.
The system was first developed in 1987 by Eastaway with former English cricketer Ted Dexter and colleague Gordon Vince, and at first the system was greeted with scepticism by many cricket lovers. Nowadays, however, it has gained credibility and has even been used by international cricketers to help negotiate their contracts - for example, Michael Bevan was for a long time rated number one in the One Day International version of the rankings and used this in contract negotiations, however he could not secure a Test spot. Known originally as the Deloittes Ratings and in later years the PwC Ratings, the system was officially adopted by the International Cricket Council in January 2005.
With a background in Operations Research and a love of cricket, Eastaway is essentially my idol! You can read more about the maths of his system in his article Howzat in Plus Magazine.
As many of the equations used in this system are now copyrighted, you can't find the exact algorithms published anywhere. However, if you are a big nerd like me, you might like the book Deloitte Ratings: The Complete Guide to Test Cricket in the Eighties by Marcus Berkmann. The book details the ratings changes after each Test series in the 80s, and the appendix contains many of the equations which underpin the system. I was given this book when I was 10 and didn't much understand it back then, but I was very happy to find it in storage when I returned from the UK, and I now find it a maths-cricket-nerd's delight!
 I'm fascinated to know if they come up with something for Twenty 20. The ultra-shortened form of the game brings in loads more complexities, not least of which is that unless you are an opening batsman, you may not even get a bat! Here's hoping Australia can win the World Twenty20 - oh and The Ashes! If only I was in the UK this summer!
I hope you enjoy this podcast - however, please note there are some audio issues. I had a great chat with Rob in a cafe in London, however my recording equipment was set on the wrong setting and so captured a lot more background noise than I had hoped! So please hang in there - this was one of my very favourite interviews. Rob is a fascinating person and had some really interesting observations on maths and sport. I really shouldn't have gone to The Chemical Brothers the night before, I probably would have had the microphone on the right setting!
Listen to this podcast here:
Sunday, 31 May 2009
Biometrics - Securing the Border
Back in 2007 I interviewed Associate Professor Stephanie Schuckers from Clarkson University for the Spoofing Biometric Security Systems article and podcast. Last week I attended the 2009 Border Security Conference in Melbourne and one of the major topics discussed was the role of biometrics in securing the border. It reminded me that I never actually published my full article on biometrics on Mr Science, so without further ado, here is an intro to biometrics, the role it plays in border security, and some of the controversies associated with it.
Can you control everything that is carried through an airport or onto a plane? Most of us are familiar with metal detectors, and the long queues that accompany checking-in. But new technologies are hoping to not only decrease the time you wait before jetting off on holiday, but also more tightly control what, and who, is taken onboard.
However, whilst this sounds like a marvellous plan, appealing to every world-weary explorer, business traveller or family with screaming kids, there is a certain amount of debate associated with the technologies at the core of the strategy.
The approach is founded on the evolving concept of biometrics, the study of methods for identifying people based upon their physical or behavioural traits. The concern is that, to be identified by these means, there must somewhere be a database of our personal traits. The technology could potentially allow us to be identified out of a crowd without our consent. Is this storage of information a breach of our civil liberties? Should we always be being watched? Or is this technology simply too crucial for law enforcement not to pursue?
Old and New Technology:
The word biometrics comes from the Greek words bio and metric, meaning “life measurement”. It is the study of methods for identifying people based on their behavioural or physical characteristics and includes well-known methods such as fingerprint analysis, which is used on every visitor entering the US, as well as retinal and iris scans, facial and voice recognition techniques, and behavioural recognition procedures that can identify you by your walk.
Airports have always been very concerned about their security. Let's have a look at some of the technologies currently being used, and investigate the progression from old-fashioned x-ray machines, to modern biometric tools.
Metal Detectors and X-Rays:
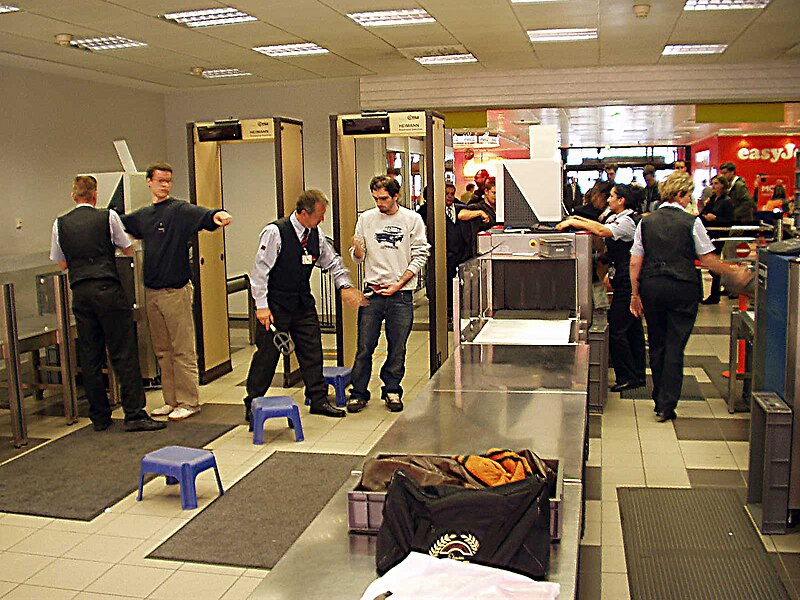 On checking in, every traveller in every airport around the world walks through a metal detector. Metal detectors work by electromagnetic induction – changing magnetic fields cause changing electric fields in metals, and vice versa. When a piece of metal is near the changing magnetic field being produced by the detector, electrical currents are induced in the metal, which then produces an alternating magnetic field of its own. This new magnetic field can then be detected and is why you need to remove metal objects like your belt when you walk through airport security.
Whilst you are walking through the metal detector, your bags are passing through an X-ray machine. As they move along the conveyor belt, X-rays, which are electromagnetic waves like light but much more energetic, are shone on the luggage. Many of the X-rays pass through unblocked by your suitcase and its contents, and detectors on the other side of your luggage measure how many of these X-rays make it through. By knowing that different things absorb different energy X-rays, a picture of your bag’s contents can be built up.
Explosives and Drug Detection:
Dogs have been used to sniff for explosives and drugs for many years, but it was only in 2003 that Explosive trace detection was introduced at Sydney airport. This system employs Ion Mobility Spectrometry. Firstly, a sample is taken by wiping a swab on your luggage or clothes. The swab is placed in the detector, and the sample is ionised – converted from its molecular form into its ionic (charged) form. The ions are separated by an electric field – different mass ions move at different speeds towards the detector, and so the time taken to arrive at the detector tells us if the telltale explosive, or drug, signature is present.
Another new method of explosive detection is terahertz spectroscopy. This technique uses radiation with a frequency between microwave and infrared, and can be more useful that X-rays as, although both X-rays and terahertz radiation can see through material, terahertz rays are non-ionising and so harmless to humans. They can also probe for chemical information, rather than just physical shape information, as many molecular excitations are within the terahertz frequency band.
Andrew Burnett, terahertz spectroscopy expert at the University of Leeds, says that the information obtained from terahertz spectroscopy is more sensitive than other radiation:
“This information is very specific, even allowing us to differentiate between different forms of the same drug… The aim is to eventually produce a system that gives us chemical specific information through clothing.”
Fingerprint analysis:
Fingerprint analysis is the oldest form of biometric identification, and is still regarded as one of the most reliable. Every visitor to the US has his or her fingerprint read on entry through an airport.
A fingerprint is an impression of the raised areas of epidermis – called friction ridges – on your finger, and everyone’s fingerprints are unique. You leave your fingerprints behind on things you touch by depositing the natural secretions – mainly water – from the eccrine glands in the friction ridge skin. These are called latent, which means hidden, fingerprints. If contaminants on the skin are also left behind, such as dirt, then they are called patent fingerprints. Patent fingerprints are easily seen by the human eye and so can be photographed and then identified as they are. Latent fingerprints are made visible by electronic, chemical and physical processing techniques such as “dusting” a crime scene.
Fingerprint analysis was traditionally completed manually by comparing the fingerprint with ink fingerprints on paper. As you can imagine, this was a very time consuming task. Modern day techniques are able to match fingerprints by using computerised databases.
An interesting fact is that the koala is one the few mammals that also has fingerprints.
Iris and Retina Recognition:
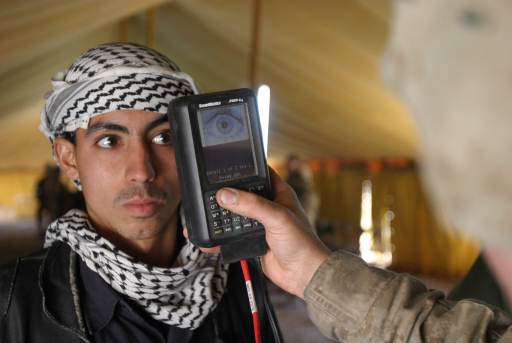 Iris scans look for patterns based on high-resolution camera images of the iris, whose intricate structure is unique to the person. Identification is unambiguous and as long as you do not damage your eye during your life, your iris scan will not change. The technology has been employed at Schiphol Airport in the Netherlands since 2001 to allow passport-free travel. The United Arab Emirates has such systems at all 17 air, land and seas ports.
Retinal recognition is slightly different, as the scan maps the capillaries feeding blood to the retina. These blood vessels absorb light more readily than the surrounding tissue, and when a ray of low-energy infrared light is shone into the eye, the reflection of the light, which depends on the capillaries, is measured. Even identical twins have different retinal scans, and like iris recognition, your retinal scan will stay the same throughout your life.
Facial Recognition:
Facial Recognition is a relatively new technology that compares facial features in the live image with those in a database. The Australian Customs Service’s SmartGate system compares the face of the examined with their image on their ePassport microchip, and replaced manual passport checks for Qantas staff in 2003.
Facial recognition is the way forward for the aviation industry, with the International Civil Aviation Organisation issuing a resolution endorsing the use of face recognition as the:
“globally interoperable biometric for machine assisted identity confirmation with machine-readable travel documents.”
Voice Recognition:
These days, it seems every time you call up your phone company or book a cab, you talk to a machine. These systems are based around voice recognition technology.
Clive Summerfield, biometrics and voice recognition expert, and CEO of Three S Holdings Pty Ltd in Canberra, thinks that over the next five years, voice biometrics will eclipse iris and facial scans and become second only in market share to fingerprinting systems.
“Voice recognition, when configured correctly, is 10 times more accurate that face, 2-3 time more accurate than fingerprint and approaching the performance of iris.”
Passports:
 A new Australian passport, the biometric ePassport, was introduced in 2005 and has an embedded microchip that stores the holder’s photograph, name, gender, date of birth, nationality, passport number, and expiry date. European countries are currently issuing passports that have the owner’s photograph and fingerprints on the chip. The US passport has a chip that is big enough to store additional biometric information such as facial recognition and retinal scan information.
Will biometrics really shorten airport queues?
Even if these new technologies work perfectly inside the airport, they will not shorten check-in queues if the public does not like them or cannot use them. M. Angela Sasse, Professor of Human-Centred Technology at University College London, researches the usability of security systems and concludes that even if a system works well, it will not gain approval if it is not easy to use or looks unpleasant. A recent iris scan trial at Heathrow airport, in which participants could not adjust the height of the scanners, and a recent US airport trial, in which dirty fingerprint readers were used, are examples of poorly designed systems.
“You should design all the processes the traveller encounters to be as easy and pleasant as possible … Make sure the system is clean and pleasant to use.”
The ethics and future of biometrics:
Identity theft is one of the fastest growing crimes in the world, and estimates have valued identity-related crime as a $2 trillion problem. Biometrics is seen as a potent weapon in the fight against identity theft, however the concern surrounding biometrics is that there must somewhere be a database of your traits. Could someone steal this information? The common fear is that once your fingerprint or retinal information is stolen, it is compromised for life, as these patterns never change.
What differentiates biometrics from other forms of security is that there must be a match between the “live” biometric scan, and the “stored” information. Unless an identity-stealer has recreated your facial expressions or other biometric information to the minutest detail, they will not be able to pass through security.
Mathew James, Managing Director of UK Biometrics Ltd., says that the fingerprinting technology used by UK Biometrics is ethically sound as a biometric thief is likely to just end up with a bunch of useless numbers:
“We do not store fingerprints and it is impossible to recreate a fingerprint from the data we store. Our scanners register up to 17 minutiae points on a fingerprint, convert these into data which is then encrypted for future comparison. Even if this data were stolen, the thief would have a lot of meaningless numbers, useless without the scanner and its attendant technology.”
Whilst biometric technologies may tightly safeguard information, desperate thieves can, however, always find a way. In 2005, Malaysian car thieves cut off the finger of a Mercedes-Benz S-Class owner when attempting to steal his car so that they could use his fingerprints to start the vehicle. And the popular television show MythBusters broke into a secured building with a photocopied fingerprint.
Stephanie Schuckers, Associate Professor of Electrical and Computer Engineering from Clarkson University, conducts research into how to prevent fingerprinting systems from being spoofed by creating fake fingerprints out of such materials as Play-Doh, and thinks that biometric security systems are an improvement on traditional methods, even if there may be some vulnerabilities.
“I try to caution people to ask, what is your security question and what is your solution now, and does biometrics improve this in terms of whatever your goals may be – convenience, improved security. Just because there is a vulnerability – well all security systems have a vulnerability – it doesn’t mean it’s not necessarily a technology that might (not) be useful.”
 Schuckers raises the example of a passport, and says that by adding a biometric element, you take a step forward to improved security.
“The current state of passports is a photo that may be 10 years old and a guy looking at you to see if it matches. Would adding a fingerprint improve the security at the borders? I would argue that that would be a step above the present technology. Can someone somehow slip a thin fake finger over their hand? Sure. That’s the state of the technology now, but you’ve made steps to improved technology.”
She believes that whilst there may be some vulnerability in biometric systems, they can be overcome by a combination of systems that would make it extremely difficult for the identity stealer to be successful.
“You can make it more difficult for someone to spoof the system by combining say a fingerprint, a card, and a PIN. So now your potential identity stealer would have to have all of those items to access the bank account… There are very simple steps that you can take now with commercially available devises that would minimise the risks”
Whether or not identity theft is likely or even possible, biometric systems are more and more being within society, with facial recognition software used in Closed Circuit Television (CCTV) all over the UK. Is this a breach of our privacy? Should Big Brother track our every move?
Schuckers believes that these are serious questions that need to be addressed by society, but that they also open up research areas to maintain the security of your personal information.
“I think those are reasonable questions that we need to ask as a society. What applications are meaningful that you would take the trade-off between privacy and the extra security you might get using the biometrics? I also see it as a research avenue. There are a lot of people researching ways to use biometric information in such a way that doesn’t actually give up your private information.”
Clive Summerfield sees the issue as a legal one, revolving around privacy and storage of sensitive personal information, as opposed to the technical challenge of safeguarding the information.
“At the end of the day, I think this will become a legal issue, where the privacy, protection and confidentiality of such information becomes legislated and that senior executives of organisations collecting, using, communicating and storing biometric information will become legally responsible for any breaches, along with biometric systems developers, implementers and vendors, who will be required to certify that their system implements the functions necessary to protect the biometric information.”
He draws a parallel with the postal service, in which stealing a letter is a federal crime, and thus protects the confidentiality of the contents of letters. There is a similar law regarding eavesdropping on telephone conversations, and these systems are widely accepted by society, despite the fact that there is little or no technological protection of information conveyed in these ways.
“Similar legal protection needs to be in place for biometrics for the mainstream of society to start to access biometrics… Anyway, I’m no legal expert – so how you go about implementing such laws, I’ll need to leave to the legal experts!”
Another concern is the storage of personal information on a single chip in your passport. Data on the chip can theoretically be stolen using wireless technology, and even if the information is encrypted, experiments in the Netherlands showed that the Dutch passport encryption could be cracked within two hours. Whilst you would never be able to set up the sensitive equipment to steal the information in our ever-more secure airports, the same could not be said about hotels and other places where you need your passport.
Mathew James thinks that in any situation in which there is a need to make sure of a person’s identity, there is a future for biometrics:
“Think of the number of keys, swipe cards, prox fobs and PINs that keep a modern airport secure. They can all be replaced by the one key which cannot be lost, stolen, forged or hacked – the human fingerprint. People can be added to, or deleted from, the system in seconds. Security staff can ‘access all areas’ without carrying a bunch of keys and passengers need only ever register once.”
As for biometric passports?
“We see a future where the only passport you will ever need will be your fingerprint, registered once in your home country.”
Can you control everything that is carried through an airport or onto a plane? Most of us are familiar with metal detectors, and the long queues that accompany checking-in. But new technologies are hoping to not only decrease the time you wait before jetting off on holiday, but also more tightly control what, and who, is taken onboard.
However, whilst this sounds like a marvellous plan, appealing to every world-weary explorer, business traveller or family with screaming kids, there is a certain amount of debate associated with the technologies at the core of the strategy.
The approach is founded on the evolving concept of biometrics, the study of methods for identifying people based upon their physical or behavioural traits. The concern is that, to be identified by these means, there must somewhere be a database of our personal traits. The technology could potentially allow us to be identified out of a crowd without our consent. Is this storage of information a breach of our civil liberties? Should we always be being watched? Or is this technology simply too crucial for law enforcement not to pursue?
Old and New Technology:
The word biometrics comes from the Greek words bio and metric, meaning “life measurement”. It is the study of methods for identifying people based on their behavioural or physical characteristics and includes well-known methods such as fingerprint analysis, which is used on every visitor entering the US, as well as retinal and iris scans, facial and voice recognition techniques, and behavioural recognition procedures that can identify you by your walk.
Airports have always been very concerned about their security. Let's have a look at some of the technologies currently being used, and investigate the progression from old-fashioned x-ray machines, to modern biometric tools.
Metal Detectors and X-Rays:
On checking in, every traveller in every airport around the world walks through a metal detector. Metal detectors work by electromagnetic induction – changing magnetic fields cause changing electric fields in metals, and vice versa. When a piece of metal is near the changing magnetic field being produced by the detector, electrical currents are induced in the metal, which then produces an alternating magnetic field of its own. This new magnetic field can then be detected and is why you need to remove metal objects like your belt when you walk through airport security.Whilst you are walking through the metal detector, your bags are passing through an X-ray machine. As they move along the conveyor belt, X-rays, which are electromagnetic waves like light but much more energetic, are shone on the luggage. Many of the X-rays pass through unblocked by your suitcase and its contents, and detectors on the other side of your luggage measure how many of these X-rays make it through. By knowing that different things absorb different energy X-rays, a picture of your bag’s contents can be built up.
Explosives and Drug Detection:
Dogs have been used to sniff for explosives and drugs for many years, but it was only in 2003 that Explosive trace detection was introduced at Sydney airport. This system employs Ion Mobility Spectrometry. Firstly, a sample is taken by wiping a swab on your luggage or clothes. The swab is placed in the detector, and the sample is ionised – converted from its molecular form into its ionic (charged) form. The ions are separated by an electric field – different mass ions move at different speeds towards the detector, and so the time taken to arrive at the detector tells us if the telltale explosive, or drug, signature is present.
Another new method of explosive detection is terahertz spectroscopy. This technique uses radiation with a frequency between microwave and infrared, and can be more useful that X-rays as, although both X-rays and terahertz radiation can see through material, terahertz rays are non-ionising and so harmless to humans. They can also probe for chemical information, rather than just physical shape information, as many molecular excitations are within the terahertz frequency band.
Andrew Burnett, terahertz spectroscopy expert at the University of Leeds, says that the information obtained from terahertz spectroscopy is more sensitive than other radiation:
“This information is very specific, even allowing us to differentiate between different forms of the same drug… The aim is to eventually produce a system that gives us chemical specific information through clothing.”
Fingerprint analysis:
Fingerprint analysis is the oldest form of biometric identification, and is still regarded as one of the most reliable. Every visitor to the US has his or her fingerprint read on entry through an airport.
A fingerprint is an impression of the raised areas of epidermis – called friction ridges – on your finger, and everyone’s fingerprints are unique. You leave your fingerprints behind on things you touch by depositing the natural secretions – mainly water – from the eccrine glands in the friction ridge skin. These are called latent, which means hidden, fingerprints. If contaminants on the skin are also left behind, such as dirt, then they are called patent fingerprints. Patent fingerprints are easily seen by the human eye and so can be photographed and then identified as they are. Latent fingerprints are made visible by electronic, chemical and physical processing techniques such as “dusting” a crime scene.
Fingerprint analysis was traditionally completed manually by comparing the fingerprint with ink fingerprints on paper. As you can imagine, this was a very time consuming task. Modern day techniques are able to match fingerprints by using computerised databases.
An interesting fact is that the koala is one the few mammals that also has fingerprints.
Iris and Retina Recognition:
Iris scans look for patterns based on high-resolution camera images of the iris, whose intricate structure is unique to the person. Identification is unambiguous and as long as you do not damage your eye during your life, your iris scan will not change. The technology has been employed at Schiphol Airport in the Netherlands since 2001 to allow passport-free travel. The United Arab Emirates has such systems at all 17 air, land and seas ports.Retinal recognition is slightly different, as the scan maps the capillaries feeding blood to the retina. These blood vessels absorb light more readily than the surrounding tissue, and when a ray of low-energy infrared light is shone into the eye, the reflection of the light, which depends on the capillaries, is measured. Even identical twins have different retinal scans, and like iris recognition, your retinal scan will stay the same throughout your life.
Facial Recognition:
Facial Recognition is a relatively new technology that compares facial features in the live image with those in a database. The Australian Customs Service’s SmartGate system compares the face of the examined with their image on their ePassport microchip, and replaced manual passport checks for Qantas staff in 2003.
Facial recognition is the way forward for the aviation industry, with the International Civil Aviation Organisation issuing a resolution endorsing the use of face recognition as the:
“globally interoperable biometric for machine assisted identity confirmation with machine-readable travel documents.”
Voice Recognition:
These days, it seems every time you call up your phone company or book a cab, you talk to a machine. These systems are based around voice recognition technology.
Clive Summerfield, biometrics and voice recognition expert, and CEO of Three S Holdings Pty Ltd in Canberra, thinks that over the next five years, voice biometrics will eclipse iris and facial scans and become second only in market share to fingerprinting systems.
“Voice recognition, when configured correctly, is 10 times more accurate that face, 2-3 time more accurate than fingerprint and approaching the performance of iris.”
Passports:
A new Australian passport, the biometric ePassport, was introduced in 2005 and has an embedded microchip that stores the holder’s photograph, name, gender, date of birth, nationality, passport number, and expiry date. European countries are currently issuing passports that have the owner’s photograph and fingerprints on the chip. The US passport has a chip that is big enough to store additional biometric information such as facial recognition and retinal scan information.Will biometrics really shorten airport queues?
Even if these new technologies work perfectly inside the airport, they will not shorten check-in queues if the public does not like them or cannot use them. M. Angela Sasse, Professor of Human-Centred Technology at University College London, researches the usability of security systems and concludes that even if a system works well, it will not gain approval if it is not easy to use or looks unpleasant. A recent iris scan trial at Heathrow airport, in which participants could not adjust the height of the scanners, and a recent US airport trial, in which dirty fingerprint readers were used, are examples of poorly designed systems.
“You should design all the processes the traveller encounters to be as easy and pleasant as possible … Make sure the system is clean and pleasant to use.”
The ethics and future of biometrics:
Identity theft is one of the fastest growing crimes in the world, and estimates have valued identity-related crime as a $2 trillion problem. Biometrics is seen as a potent weapon in the fight against identity theft, however the concern surrounding biometrics is that there must somewhere be a database of your traits. Could someone steal this information? The common fear is that once your fingerprint or retinal information is stolen, it is compromised for life, as these patterns never change.
What differentiates biometrics from other forms of security is that there must be a match between the “live” biometric scan, and the “stored” information. Unless an identity-stealer has recreated your facial expressions or other biometric information to the minutest detail, they will not be able to pass through security.
Mathew James, Managing Director of UK Biometrics Ltd., says that the fingerprinting technology used by UK Biometrics is ethically sound as a biometric thief is likely to just end up with a bunch of useless numbers:
“We do not store fingerprints and it is impossible to recreate a fingerprint from the data we store. Our scanners register up to 17 minutiae points on a fingerprint, convert these into data which is then encrypted for future comparison. Even if this data were stolen, the thief would have a lot of meaningless numbers, useless without the scanner and its attendant technology.”
Whilst biometric technologies may tightly safeguard information, desperate thieves can, however, always find a way. In 2005, Malaysian car thieves cut off the finger of a Mercedes-Benz S-Class owner when attempting to steal his car so that they could use his fingerprints to start the vehicle. And the popular television show MythBusters broke into a secured building with a photocopied fingerprint.
Stephanie Schuckers, Associate Professor of Electrical and Computer Engineering from Clarkson University, conducts research into how to prevent fingerprinting systems from being spoofed by creating fake fingerprints out of such materials as Play-Doh, and thinks that biometric security systems are an improvement on traditional methods, even if there may be some vulnerabilities.
“I try to caution people to ask, what is your security question and what is your solution now, and does biometrics improve this in terms of whatever your goals may be – convenience, improved security. Just because there is a vulnerability – well all security systems have a vulnerability – it doesn’t mean it’s not necessarily a technology that might (not) be useful.”
 Schuckers raises the example of a passport, and says that by adding a biometric element, you take a step forward to improved security.
“The current state of passports is a photo that may be 10 years old and a guy looking at you to see if it matches. Would adding a fingerprint improve the security at the borders? I would argue that that would be a step above the present technology. Can someone somehow slip a thin fake finger over their hand? Sure. That’s the state of the technology now, but you’ve made steps to improved technology.”
She believes that whilst there may be some vulnerability in biometric systems, they can be overcome by a combination of systems that would make it extremely difficult for the identity stealer to be successful.
“You can make it more difficult for someone to spoof the system by combining say a fingerprint, a card, and a PIN. So now your potential identity stealer would have to have all of those items to access the bank account… There are very simple steps that you can take now with commercially available devises that would minimise the risks”
Whether or not identity theft is likely or even possible, biometric systems are more and more being within society, with facial recognition software used in Closed Circuit Television (CCTV) all over the UK. Is this a breach of our privacy? Should Big Brother track our every move?
Schuckers believes that these are serious questions that need to be addressed by society, but that they also open up research areas to maintain the security of your personal information.
“I think those are reasonable questions that we need to ask as a society. What applications are meaningful that you would take the trade-off between privacy and the extra security you might get using the biometrics? I also see it as a research avenue. There are a lot of people researching ways to use biometric information in such a way that doesn’t actually give up your private information.”
Clive Summerfield sees the issue as a legal one, revolving around privacy and storage of sensitive personal information, as opposed to the technical challenge of safeguarding the information.
“At the end of the day, I think this will become a legal issue, where the privacy, protection and confidentiality of such information becomes legislated and that senior executives of organisations collecting, using, communicating and storing biometric information will become legally responsible for any breaches, along with biometric systems developers, implementers and vendors, who will be required to certify that their system implements the functions necessary to protect the biometric information.”
He draws a parallel with the postal service, in which stealing a letter is a federal crime, and thus protects the confidentiality of the contents of letters. There is a similar law regarding eavesdropping on telephone conversations, and these systems are widely accepted by society, despite the fact that there is little or no technological protection of information conveyed in these ways.
“Similar legal protection needs to be in place for biometrics for the mainstream of society to start to access biometrics… Anyway, I’m no legal expert – so how you go about implementing such laws, I’ll need to leave to the legal experts!”
Another concern is the storage of personal information on a single chip in your passport. Data on the chip can theoretically be stolen using wireless technology, and even if the information is encrypted, experiments in the Netherlands showed that the Dutch passport encryption could be cracked within two hours. Whilst you would never be able to set up the sensitive equipment to steal the information in our ever-more secure airports, the same could not be said about hotels and other places where you need your passport.
Mathew James thinks that in any situation in which there is a need to make sure of a person’s identity, there is a future for biometrics:
“Think of the number of keys, swipe cards, prox fobs and PINs that keep a modern airport secure. They can all be replaced by the one key which cannot be lost, stolen, forged or hacked – the human fingerprint. People can be added to, or deleted from, the system in seconds. Security staff can ‘access all areas’ without carrying a bunch of keys and passengers need only ever register once.”
As for biometric passports?
“We see a future where the only passport you will ever need will be your fingerprint, registered once in your home country.”
Saturday, 23 May 2009
Correlation of the Week: Zombies, Vampires, Democrats and Republicans
 A friend of mine recently pointed me in the direction of an article in signonsandiego.com called With Obama election comes the return of the vampire. This article puts forward the theory that more vampire movies come out when Democrats are elected to the US Presidency, and more zombie movies come out when the Republicans are in office.
Recent evidence of this is the new Twilight vampire flick - coinciding with the election of Democrat Obama - and the spate of zombie films during George W. Bush's presidency - for example 28 Days Later, 28 Weeks Later and Dawn of the Dead. The original article looks back in time at various presidencies and it makes compelling reading.
What is the reason behind this (if there really is one)? One argument put forward is that the movies depict what we fear at the time. Democrats, who believe in redistributing wealth among the people, fear the Wall Street vampires who bleed the nation dry. Vampires, such as Dracula, represent the aristocracy. Republicans fear a revolt of the poor and disenfranchised, and as such fear zombies.
But, is there any truth to this argument? Let's turn to the data. The easiest way to determine the number of vampire and zombie films which have come out over the last 50 years is to look at The Internet Movie Database. Using its power search, I was able to find the number of movies (not TV-movies , TV-shows or direct-to-video movies, but only big screen movies - imagine trying to quantify every TV-show ever made, not even imdb is that complete) made each year in the US since 1953 (a seemingly good point to start this analysis as there is plenty of data about the movies made in this time - it's also the presidency of Republican Dwight D. Eisenhower), as well as the number of movies tagged "vampire" and "zombie". You can see this data in the following table, where the year is the starting year of the presidency:
 We've plotted the number of zombie and vampire films produced as a percentage of all films produced that presidential term in the US:
 A stand out result is the large number of zombie films made in the 1980s under Reagan. It seems clear that zombie films peak in Republican years, but it is less clear whether vampire films have similar peaks under Democrats.
Indeed, the average percentage of movies that are zombie-themed produced during a Democratic presidency is 0.372%, whilst under the Republicans it is 0.571% - this is a large difference. The average percentage of movies that are vampire-themed produced during a Democratic presidency is 0.544%, whilst under the Republicans it is 0.491% - the percentage moves in the direction of our theory, but not by much.
Using a single-tailed Student's t-test (named after its inventor William Sealy Gosset, whose nom de plume was Student - I thought at school that it was named this because it was used by students, anyway...) to test between the null-hypothesis that the governing party makes no difference to the types of movies made and the theories that zombie movies go up under Republicans and vampire movies under Democrats, we find the t-statistic for the zombie case to be -1.69 which gives a p-value 5.7%. What this means is that there is a 5.7% chance that there is no significant difference between the zombie results under Democrats and Republicans. This is very close to the 5% level most statisticians accept for significance, and as such is a very intriguing result.
For the vampire case, our p-value is 33% and so there is little chance of significance. Both tests could be improved with more data (what every statistician needs!)
In summary, there just might be something in this (for the zombies anyway.) There is an almost significant difference between the percentage of zombie movies made under Democrats and Republicans. To predict the next election, it could well be worth looking at how many zombie movies are planned for the inauguration year and the 3 years after it. As most movies are planned more than a year ahead of time, this could be an interesting election predictor.
I guess we now know where George W. Bush's brains went! Brains.....
Subscribe to:
Posts (Atom)


