Tuesday, 5 April 2011

Are NSW players over-represented in the Australian cricket team?


In every sports competition in the world, fans of one team will claim another team gets more favourable treatment than their own, whether it’s selection in representative teams, concessions regarding player salaries or favourable refereeing decisions. Cricket in Australia is no different. The dawn of summer is almost inevitably accompanied by bleating, generally from Victorian fans, about how players from New South Wales are more likely to be selected in the national team than players from other states. This opinion found a voice in David Hookes, who claimed:

"When they give out the baggy blue cap in New South Wales, they give you a baggy green one in a brown paper bag as well to save making two presentations."

It’s about time we put this idea to the test. Since the 1977/78 season, all 6 Australian states have played in the Sheffield Shield, Australia’s domestic first-class cricket competition. Since 1982/83, the season has culminated in a grand final (previous to this the winner was determined league style by whoever won the most throughout the season). I will use data from 1982/83 till now for consistency and so that all states are represented. The following table shows the players who have debuted for Australia since the start of the 1982/83 season, the state they were playing for at the time of their debut, and the number of Tests they played throughout their career.

PlayerYearsTestsStatePlayerYearsTestsState
Carl Rackemann 1982–9112QldMatthew Elliott 1996–200421Vic
Kepler Wessels 1982–8524QldMichael Kasprowicz 1996–200638Qld
Tom Hogan 1983–847WAJason Gillespie 1996–200671SA
Roger Woolley 1983–842TasAndy Bichel 1997–200319Qld
Wayne B. Phillips 1983–8627SAShaun Young 19971Tas
John Maguire 1983–843QldSimon Cook 19972NSW
Greg Matthews 1983–9333NSWStuart MacGill 1998–200844NSW
Steve Smith 19843NSWGavin Robertson 19984NSW
Dean Jones 1984–9252VicPaul Wilson 19981SA
David Boon 1984–96107TasAdam Dale 1998–992Qld
Bob Holland 1984–8611NSWDarren Lehmann 1998–200427SA
Murray Bennett 1984–853NSWColin Miller 1998–200118Tas
Craig McDermott 1984–9671QldMatthew Nicholson 19981WA
Simon O'Donnell 19856VicAdam Gilchrist 1999–200896WA
Dave Gilbert 1985–869NSWScott Muller 19992Qld
Robbie Kerr 19852QldBrett Lee 1999–201076NSW
Merv Hughes 1985–9453VicSimon Katich 2001–56WA
Geoff Marsh 1985–9250WAMartin Love 2002–035Qld
Bruce Reid 1985–9227WABrad Williams 2003–044WA
Steve Waugh 1985–2004168NSWNathan Bracken 2003–055NSW
Simon Davis 19861VicAndrew Symonds 2004–0926Qld
Tim Zoehrer 1986–8710WAMichael Clarke 2004–67NSW
Chris Matthews 1986–883WANathan Hauritz 2004–17Qld
Greg Dyer 1986–886NSWShane Watson 2005–25Qld
Peter Taylor 1987–9113NSWShaun Tait 2005–083SA
Mike Veletta 1987–908WAMichael Hussey 2005–57WA
Tim May 1987–9524SABrad Hodge 2005-086Vic
Tony Dodemaide 1987–9210VicPhil Jaques 2005–0811NSW
Ian Healy 1988–99119QldStuart Clark 2006–0924NSW
Trevor Hohns 19897QldDan Cullen 20061SA
Mark Taylor 1989–99104NSWMitchell Johnson 2007–40Qld
Greg Campbell 1989–904TasChris Rogers 20081WA
Tom Moody 1989–928WABrad Haddin 2008–30NSW
Mark Waugh 1991–2002128NSWBeau Casson 20081NSW
Shane Warne 1992–2007145VicCameron White 2008–094Vic
Wayne N. Phillips 19921VicPeter Siddle 2008–20Vic
Paul Reiffel 1992–9835VicJason Krejza 20082Tas
Damien Martyn 1992–200667WADoug Bollinger 2009–12NSW
Justin Langer 1993–2007105WAAndrew McDonald 20094Vic
Jo Angel 1993–954WABen Hilfenhaus 2009–15Tas
Michael Slater 1993–200174NSWPhillip Hughes 2009–8NSW
Brendon Julian 1993–957WAMarcus North 2009–21WA
Glenn McGrath 1993–2007124NSWBryce McGain 20091Vic
Matthew Hayden 1994–2009103QldGraham Manou 20091SA
Michael Bevan 1994–9818NSWClint McKay 20091Vic
Damien Fleming 1994–200120VicRyan Harris 2010–4SA
Phil Emery 19941NSWTim Paine 20104Tas
Greg Blewett 1995–200046SASteven Smith 2010–3NSW
Peter McIntyre 1995–962SAPeter George 2010–1SA
Stuart Law 19951QldXavier Doherty 20102Tas
Ricky Ponting 1995–151TasMichael Beer 2011–1WA
Brad Hogg 1996–20087WAUsman Khawaja 2011–1NSW

Of the 104 players who debuted after 1982/83, 28 were playing for NSW when they were first picked for Australia (27% of the new players).

PlayersPercentage
NSW2827%
WA2019%
Qld1817%
Vic1615%
Tas1010%
SA1212%

Clearly NSW players have played more Tests. But is this unreasonable? There are two measures we can look at here. Sheffield Shield results and state populations. The following shows the results of the Shield since 1982/83.

Season Winner Second Third Fourth Fifth SixthSeason Winner Second Third Fourth Fifth Sixth
1982–83 NSWWASATasQldVic1997–98 WATasQldNSWVicSA
1983–84 WAQldTasNSWSAVic1998–99 WAQldVicSATasNSW
1984–85 NSWQldSAWAVicTas1999-00 QldVicWASATasNSW
1985–86 NSWQldVicWASATas2000–01 QldVicNSWTasWASA
1986–87 WAVicQldSANSWTas2001–02 QldTasWASAVicNSW
1987–88 WAQldNSWVicSATas2002–03 NSWQldVicSAWATas
1988–89 WASAQldNSWTasVic2003–04 VicQldTasWANSWSA
1989–90 NSWQldSATasWAVic2004–05 NSWQldWAVicSATas
1990–91 VicNSWQldWASATas2005–06 QldVicSATasWANSW
1991–92 WANSWVicQldSATas2006–07 TasNSWVicQldWASA
1992–93 NSWQldWASATasVic2007–08 NSWVicWATasSAQld
1993–94 NSWTasWAVicSAQld2008–09 VicQldSATasWANSW
1994–95 QldSAVicWANSWTas2009–10 VicQldNSWWATasSA
1995–96 SAWAQldTasNSWVic2001–11 TasNSWQldWAVicSA
1996–97 QldWANSWTasVicSA

NSW has won 9 Shields, ahead of WA’s 7. If you look at the percentage of Shield wins per state and compare this to the number of players picked for Australia from that state, you will notice that these results are remarkably similar. Is it any surprise that the most successful team over this time has more players picked for representative honours? If you look at all the Tests played since 82/83, 34% of the Test positions up for grabs were occupied by NSW players, and the order of states is exactly the same as the order for number of Shield wins. This is strong evidence that rather than a selection bias, players are being picked either because they are the best players or because they have been a part of successful teams.

PlayersTestsShield wins
NSW2827%98334%931%
WA2019%54018%724%
Qld1817%51618%621%
Vic1615%38013%414%
Tas1010%30610%27%
SA1212%2087%13%

The second way to look at this is by state population. I don’t particularly like this method because sportsmen, especially in this professional age, move teams for many reasons, including for better opportunities and more pay, and don’t necessarily play for the state of their birth. The most populous state is not necessarily going to have the best team. But because this is often the first measure people look to when analysing team results (for example, Olympic results), and because arguably a larger population means a bigger economy and therefore more money flowing through the team, we shall include some analysis. Since 1982, NSW (+ACT) has averaged 36% of the total population of the states (excluding Northern Territory). Again, this matches quite closely the number of players picked for Australia – indeed, you might argue that more players from NSW should have been picked. It would be by this measure that Victorians may claim some bias.

PopulationShield Wins
NSW + ACT36%31%
Vic25%14%
Qld18%21%
WA10%24%
Tas3%7%
SA8%3%

Finally, let’s look at the one-test wonders – the players who only played one test.

One Test wonders
NSW3
WA3
Qld1
Vic4
Tas1
SA4

Victoria and SA share this honour with 4 one-test wonders – and this is possibly why David Hookes, of SA stock and coach of Victoria after his retirement, was cranky. In the case of SA, this is a third of their players who have made their debut since 1982/83 – indeed, 7 of their 12 Test players did not play more than 4 Tests. Tasmanian players also fair poorly in this regard, with 6 of their 10 players playing no more than 4 Tests – Tasmanian results are severely skewed by Ponting’s 151 and Boon’s 107 Tests.

No matter what state a Test player is from, he has roughly the same chance of playing 15 or more Tests. Thus the data does not support the idea that selectors are more likely to stick with NSW players through a patch of poor form.

Percentage of state Test players (15+ Tests)
NSW43%
WA40%
Qld56%
Vic44%
Tas40%
SA42%

I would be interested to hear your thoughts regarding this – I know it can stir some passions. But the data would suggest that there is no unfair bias towards NSW.

Further thoughts:
  • I have made no attempt to look at players moving state during their careers. Simon Katich, for instance, had a career revival when playing for NSW, even though he was originally picked for Australia when playing for WA. Nathan Hauritz similarly had his fortunes revived when playing for NSW, even though he debuted when playing for Queensland. There are also many examples of this working the other way – Jason Krejza moved to Tasmania, and Adam Gilchrist to WA, both from NSW and then made their debut. Even Don Bradman first played for NSW before an ongoing career with SA.
  • You could do the same analysis if you have time and patience on your hands for one-day and Twenty20 cricket.
  • It was quite difficult in some cases to track which state a player was playing for when they made their Australian debut, especially if they moved state soon after. I have put the data here (some of the array formulae don't work in Google docs, and I have stripped out the macros, but you can redo them). If I have made a mistake, let me know!

Monday, 14 February 2011

Search Traffic in Egypt

The Egyptian Revolution of 2011 was a series of street demonstrations that demanded the overthrow of the Egyptian President Hosni Mubarak. One of the government retaliations to the protests was to shut down the Internet. Imagine you're a youth in Egypt and all of a sudden you don't have access to the Internet with its social networks, games and unlimited porn. You'd protest too! Great strategy guys...

Here is the Google search traffic in Egypt normalised against world-wide Internet traffic, created through Google Transparency Report. As you can see, it took a little less than a week for the government to realise their folly.

Wednesday, 9 February 2011

Science events for February, and a little bit of Valentine love


February is a big month for science, and a big month for love. Here are a couple of events that caught my eye.

Worldwide:

The Global Google Science Fair is an online science competition open to all students aged 13 to 18 from around the world. Unfortunately, I'm now way too old to enter, but were I still at school, this would be a fantastic opportunity to have some fun with science and technology. Scientific American, Lego, National Geographic and CERN are partners in the science fair, whose winner will receive a $50,000 scholarship, a 10-day trip to the Galápagos Islands and a virtual internship at Lego or a three-day site visit to CERN, Google or Scientific American.

The idea behind the show is that it is a chance for participants to showcase their ideas and experiments. Entrants are required to submit their work either as a video or slide show on their website (using Google products of course), and the works can fall into the following categories:
  1. Computer Science & Math
  2. Earth & Environmental Sciences
  3. Behavioral & Social Sciences
  4. Flora & Fauna
  5. Energy & Space
  6. Inventions & Innovation
  7. Physics
  8. Biology
  9. Chemistry
  10. Food Science
  11. Electricity & Electronics
Check out the Official Rules carefully and watch the video below for an introduction:


Sydney:

The Powerhouse Museum is opening three new exhibitions in February and March 2011. The exhibitions, Engineering Excellence (open now), designTECH (opens 19 February) and Student Fashion (opens 12 March), showcase emerging innovators and designers in New South Wales.

Six local and international contemporary engineering projects that recently received industry awards are on display in Engineering Excellence. They include a spectacular, fully-glazed building, design-engineered to a complex geometry with a unique waste collection and removal system, in one of the Middle East’s biggest developments in Abu Dhabi; an articulated head featuring a robotic arm attached to the image of a human face that ‘chats’ with the visitor; an internet laboratory for engineering students living and working remotely; new technology for producing renewable energy for electricity generators; a new optical device for microscopes that lights up hard-to-detect bacteria; and a new track safety system for a 350km per hour China Fast Train project.

Furniture, fashion, technology and leisure products are among more than twenty HSC student works in designTECH.  Humanitarian concerns such as the 2010 Haiti earthquake and the use of child labour in manufacturing, and health and safety issues such as 2009 swine flu and pool drownings were just a few of the motivating factors that inspired the student works. Some of the unique ideas on show include a homeless shelter designed for natural disasters; a brake device for runaway prams; a supermarket trolley aid for the elderly; a learner driver log iPhone app; and a pool fence alarm system.

Adelaide (and the world):

We've blogged and podcast about the science of love and sex many times, and with Valentine's Day coming up, the Royal Institute in Adelaide is putting on a special love themed event, Seven Deadly Sins: 'Lust' - Is Love Blind? Running the show will be Rob Brooks, who we spoke to at the end of last year in Ep 136: Sexual Selection about how evolution not only favours animals with the ability to survive, but also those who are attractive to the opposite sex and therefore more likely to reproduce. If you can't make the Adelaide event, it will streamed live on their site.

While we're on the topic of love and Valentine's Day, if you are looking to get the attention of that one special person, check out the Science of Speed-Dating, and our Scientific Dating Tips. If you are lucky enough to be waist deep in romance, then check out the reasons why we fall in love, and how love is simply a chemical process in the brain. And if you simply just want to get lucky, then check out:
If you think this whole love and sex thing is just one big joke, then perhaps the idea that those who are more sexually appealing may be dumber might be up your alley. Or talk sex over a beer with the Beer Drinking Scientists.

Tuesday, 25 January 2011

Ep 140: The Redback Spider invasion of New Zealand


Research published in Biological Invasions shows that Australian redback spiders are invading New Zealand and could become established in many urban areas around major ports.

The paper, The invasive Australian redback spider, Latrodectus hasseltii Thorell 1870 (Araneae: Theridiidae): current and potential distributions, and likely impacts, details recorded sightings of redback spiders in New Zealand, then used biological and climatic information to reveal where redbacks could establish. Warm, dry conditions in some eastern areas of New Zealand are suitable for redback spiders to become established, and they are likely to spread further as they are surviving in places with relatively high rainfall. Urban areas, for example, provide shelter from the rain. The spread of redbacks is likely to have arisen from the establishment of new invasions through New Zealand's ports.

There is genetic evidence that redbacks have interbred with the protected, endemic katipo and there is a danger that redbacks could competitively displace katipo or cause extinction by interbreeding. Redbacks are also a public health issue as they have the potential to become established in areas close to urban populations. Successful border control already produces regular interceptions of the redback as well the invasive brown widow and the western black widow. Both these species are related to the redback and have similar habitat and climate requirements.

I spoke to lead researcher Dr Cor Vink about this work and how they are developing new approaches and tools to ensure harmful organisms are kept out of New Zealand.

Click play below or listen to this show here.


References:
Cor J. Vink, José G. B. Derraik, Craig B. Phillips, & Phil J. Sirvid (2010). The invasive Australian redback spider, Latrodectus hasseltii Thorell 1870 (Araneae: Theridiidae): current and potential distributions, and likely impacts. Biological Invasions

Sunday, 16 January 2011

And introducing....


Hope you've all had a wonderful Christmas and New Year. We'd like to introduce you to our little bloke, Luka, born on the 29th December 2010. Everyone here is happy and healthy, if a little tired. I'll get back to the blogging and podcasting soon...

Friday, 24 December 2010

Ep 139: Christmas special - Santa, sport and out-takes


It's scarcely believable that another Christmas has rolled around! I hope that 2010 has been a wonderful year for you.

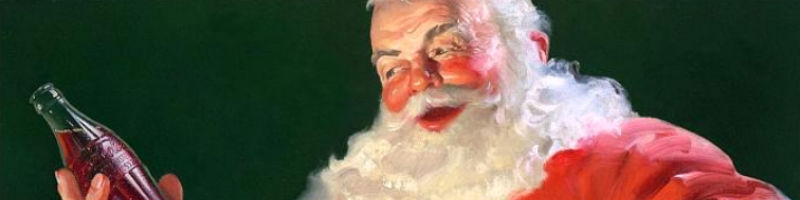
In this year's Christmas podcast, I've compiled some of my favourite segments from the last few years. First up, I chat to Bianca Nogrady, who assembled a crack team of health experts to look into the health of Santa Claus. Not only does he eat copious amounts of sugar and drink gallons of beer, he is also at risk of altitude sickness, deep-vein thrombosis, jet-lag, zoonotic diseases from exposure to wild reindeer and countless other problems associated with lack of sleep and poor diet. Not to mention all the concerns associated with smoking. However, he does compile the naughty/nice list each year, keeping his mind active, and unlike many other elderly folk, he gets out of the house and travels. You can read more about the findings of the Santa-team in Bianca's original article Health alert for Christmas visitor, and also at Ep 98: Santa Claus - a fat, diabetic substance abuser?

Next up is a classic out-take from Diffusion Science Radio from the velvet-voiced Matt Clarke discussing the fact that some women are allergic to their partner's semen. You will also hear the laughing of myself, Darren Osborne, Lachlan Whatmore and Tilly Boleyn (and possibly Ian Woolf). These same folk then join me in an interesting, and irreverent, take on some of the mental aspects of cricket. These recordings were originally released in the episode North Koreans, Mammoths, Invisibility and what did not make it to air on the Diffusion Radio Science Show.

Take care this break, and see you in the new year, when my family will have expanded by one!

Click play below or listen to this show here, and have yourself a merry Christmas!

Saturday, 11 December 2010

Ep 138: The health benefits of breakfast


A world first study conducted by Menzies Research Institute Tasmania has shown that skipping breakfast over a long period of time may increase your risk of heart disease and diabetes.

The study, Skipping breakfast: longitudinal associations with cardiometabolic risk factors in the Childhood Determinants of Adult Health Study, published in the American Journal of Clinical Nutrition, followed up a 1985 national sample of 9–15 year old Australian children. The original work looked at whether these children ate breakfast before school. In 2004–2006, the authors of the new research tracked down 2184 participants of the original study (26–36 years of age) and enquired into their breakfast eating habits. This style of study is called a Longitudinal Study.

After adjustment for age, sex, and sociodemographic and lifestyle factors, participants who skipped breakfast in both childhood and adulthood had a larger waist circumference, higher fasting insulin, and higher total cholesterol concentration than did those who ate breakfast at both time points. The researchers conclude that skipping breakfast over a long period may have detrimental effects on cardiometabolic health.

I had a great chat to lead researcher Kylie Smith about her study. Listen in to this show here (or press play below):


Songs in the podcast:
I Love ManciniHarry Allen
"Breakfast At Tiffany's"

from "I Love Mancini"
My Many MoodsAmy Stephens Group
"Breakfast In Atlanta"

from "My Many Moods"

References:
Smith KJ, Gall SL, McNaughton SA, Blizzard L, Dwyer T, & Venn AJ (2010). Skipping breakfast: longitudinal associations with cardiometabolic risk factors in the Childhood Determinants of Adult Health Study. The American journal of clinical nutrition, 92 (6), 1316-25 PMID: 20926520
 

Wednesday, 1 December 2010

2D / 3D / 4D Baby Ultrasounds

Being able to see your unborn child is truly an amazing experience. Ultrasound (diagnostic sonography) is a common diagnostic tool for, among other things, imaging the foetus to determine its age, look for abnormalities and observe blood flow in the umbilical cord. But possibly its most memorable effect is seeing your baby's heart beat - and in 3D/4D ultrasounds, seeing your baby's face.

The term "ultrasound" applies to acoustic energy (sound) with a frequency above the audible range of human hearing (20 Hz -20 kHz). When used in medical imaging, an ultrasonic sensor (or transducer) is placed on the mother's belly and produces pulses of sound. The frequencies used for medical imaging are generally in the range of 1 to 18 MHz. High frequencies (7-18 MHz) can be used to look for fine details but have low penetration, so to image deep tissue, lower frequencies (1-6 MHz) are used.

The sound waves are partially reflected from layers between different tissues inside the mother's body. Sound is reflected anywhere there are density changes - for example, at the baby's skin where it meets the amniotic fluid. The baby's internal organs can also be imaged depending on what frequencies you use. The reflected sound is then "heard" by the transducer, and the data analysed to produce the image. The amount of time it takes for the echo to rebound relates to how deep the sound penetrated, and the strength of the return signal relates to both the material it is reflecting off and its depth. The deeper the tissue from which the signal is being echoed, the quieter the return, simply because there is more sound loss (attenuation) the further the sound travels (it gets absorbed, scattered and reflected along the way). This information allows an image to be built up, whereby pixels at the appropriate depth are coloured by the strength of the return at that point. Generally, the sound waves are not 100% reflected at any stage - you can see "behind" objects because some sound penetrates through. However, as less sound is penetrating the deeper you go, the signals become fainter.

2D Ultrasounds

Baby face 2D scan

The typical ultrasound image is a "2D" image like the one above. In this image, the transducer is at the top and is sending sound waves down. The image is essentially a slice through the mother. It's called a 2D image as we can only see two dimensions - left/right and up/down. The 2D image is built by firing a sound beam down, waiting for the return echoes, and then firing a new pulse at a slightly different angle. This continues until an arc is swept. Combining the data from each line after the arc is swept gives the 2D image. The following images come from the excellent resource Basic ultrasound, echocardiography and Doppler for clinicians, by Asbjorn Støylen. The left image shows the transducer scanning whilst the right image shows how the pulses are sent down in lines.


Continual rescanning means that a 2D video can be produced with roughly 50 frames per second. The human eye can see about 25 frames per second and so the video looks smooth. This frame rate is also more than enough for 2D temporal visualisation of the baby's heartbeat (~70-150 beats per minute depending on age) and to watch blood flow through Doppler ultrasound. Due to the Doppler effect, the sound pulse will rebound with a higher frequency if it hits something moving towards it, and a lower frequency if it echoes from something moving away from it - this is the same reason the noise of a car has a high pitch when moving towards you, and a low pitch as it moves away. As blood is moving in the umbilical cord, the ultrasound can be coloured by the Doppler information to show the blood flow.

3D Ultrasounds

Baby face

3D images are a fairly recent advance in diagnostic sonography. Instead of just seeing a slice through the mother, the images can show a surface - essentially adding depth (the third dimension) to the 2D image. Imagine you are looking at a car from front on - you have no idea how long the car is and you have no information on how many doors it has or if the boot is open. However, if you look at the car from another angle, you can figure this out, and the more angles you look down, the more depth information you can gain. This is essentially what a 3D ultrasound does - it stitches together multiple 2D shots from different angles to produce the image. Modern transducers have the ability to scan multiple cross-sections. If the baby is moving, there may be some blur, but as image processing is becoming quicker, the 3D images are becoming clearer. The colour of the image is not real as there is no way to see colour inside the mother. 3D scans provide information for the diagnosis of facial anomalies, evaluation of neural tube defects, and skeletal malformations, and also helps the parents bond with their unborn child (it's very cool). However, when compared to 2D scans, they aren't as useful for the diagnosis of congenital heart disease and central nervous system anomalies. One of the reasons why this is the case is because they are static, which leads us to...

4D Ultrasounds

The term 4D refers to the addition of time to 3D scans. This is a very recent advance as it is only in the last few years that we have had the computing power to not only stitch together the 2D images to make the 3D images, but to create the 3D images quickly enough to play them consecutively as a video. Modern 4D scans play at roughly 12 frames per second, so they are a little jumpy.

Here is a little video I put together of our 4D scan.


I don't know if there is an upper bound on what ultrasound technology can do - as the speed of sound is ~1540 m/s in human soft tissue, and you have no choice but to wait for the return signal before you can process the image, it may be that a high video frame rate with decent resolution is unobtainable. Resolution depends on how many different lines you fire down to make the first 2D image - more lines mean better resolution, but currently you have to wait for the echo from one line before sending down the next, which means it takes longer to produce an image. I imagine one way of improving this would be to send down all the lines at once with slightly different frequencies or waveforms, and as such when the echo is received you would know where it came from. Perhaps this is already being done - let me know if you know more!

Check out the video of Massive Attack's Teardrop in which there is a singing foetus, and I also have more images over at my ultrasound set on flickr.

References:
  • Kurjak, A., Miskovic, B., Andonotopo, W., Stanojevic, M., Azumendi, G., & Vrcic, H. (2007). How useful is 3D and 4D ultrasound in perinatal medicine? Journal of Perinatal Medicine, 35 (1), 10-27 DOI: 10.1515/JPM.2007.002 
  • Carrera, J.M. (2006). Donald School Atlas of Clin. Application of Ultrasound in Obs/ Gyn www.jaypeebrothers.com DOI: 10.5005/jp/books/10226
  • Khanem, N. (2007). Donald School Textbook of Ultrasound in Obstetrics & Gynecology The Obstetrician & Gynaecologist, 9 (2), 140-140 DOI: 10.1576/toag.9.2.140.27325 

Wednesday, 24 November 2010

Ep 137: Can your environment change your DNA?


Did you know that worker bees and queen bees have exactly the same DNA?

Although they look and behave differently, at birth they have the same genome. Young queen larvae are fed a diet of Royal Jelly, a substance secreted by the worker bees which includes B-complex vitamins, proteins, sugars and fatty acids. It also contains trace minerals, enzymes, antibacterial and antibiotic components, and vitamin C. This concoction not only feeds the queen bees, it turns on and off various genes with what are known as epigenetic effects. Epigenetic effects - meaning "above the genome" - alter gene expression without affecting the baseline genetic code. They are the reason why cells in different parts of the body do different things. For example, liver genes are turned on in your liver but not elsewhere, even though every cell in your body contains all your DNA information. For humans, much of this happens when we are embryos before we are born, with various chemical signals switching on and off genes in various parts of the body.

The recent report The Honey Bee Epigenomes: Differential Methylation of Brain DNA in Queens and Workers, by Professor Ryszard Maleszka from The Australian National University’s College of Medicine, Biology and Environment and colleagues, details the extensive molecular differences in over 550 genes in the brains of worker and queen bees as a result of queen bee feeding with royal jelly.

The work is quite profound as it is a step towards understanding how our environment can change our DNA. There is a growing body of evidence that suggests some epigenetic traits may be passed on to following generations rather than just affecting the individual, and this could drastically change our understanding of the process of evolution. The work also has implications for the nature vs. nurture debate, if indeed our nurture can actually change our DNA - that is, our nature.

I had a fascinating chat to Ryszard about this study, the future of this work and his opinions on how this may change our understanding of evolution. Listen in to this show here (or press play below):


Please excuse the noise in the recording of the phone call.

References:
Lyko F, Foret S, Kucharski R, Wolf S, Falckenhayn C, & Maleszka R (2010). The honey bee epigenomes: differential methylation of brain DNA in queens and workers. PLoS biology, 8 (11) PMID: 21072239

Tuesday, 23 November 2010

Why noble gases do not bond

This is actually an advertisement for the Marie Curie Actions, which is part of a research push by the European Commission. Thanks to Dr Boob for putting me on to this.


Sorry for not posting any original content, or any podcast episodes, recently. Stay tuned, more coming out this week...

Wednesday, 17 November 2010

Science Cheerleaders

I am really quite baffled by Science Cheerleaders. What say you? Do you think it "breaks down the stereotype?"

Friday, 12 November 2010

What is the collective noun for a group of scientists?


When you're at a pub and you see a bunch of scientists in the corner, gazing at their shoes and looking generally uncomfortable, what do call them? Is it a group of scientists? A gaggle of scientists? A murder of scientists? My quick googling didn't give me an answer, so I put the question out on twitter and facebook - what is the collective noun for a group of scientists? Here is what came in:
  • A cat-herd
  • A quantum
  • A cabal
  • A tribe
  • A gaggle
  • A whiteout
  • A multipact
  • A maxineurone
  • A quadrant
  • A sample
  • A study
  • A congregation
  • A plethora
  • A nerdlet
  • A conglomerate
  • A floc
  • A concurrence
  • A quadribble
  • A thinktank
  • A confusion
  • A bunsen
  • A titration
  • A force
  • An experiment
  • A geek
  • A meter
  • A beaker
  • A discipline
  • A method
  • An examination
  • A conjecture
  • A dogma
  • An array
  • A geek
  • An ego
Do you have a particular favourite not mentioned? Let us know! I quite like "a force of scientists" - direct and to the point, scientifically relevant, and it sounds cool.

Wednesday, 27 October 2010

The Piffle Paradox - or how pure mathematicians have fun


Ever wondered how pure mathematicians have fun? The following is from the 1967 paper Modern Research in Mathematics by A. K. Austin, from the Department of Pure Mathematics at the University of Sheffield. It's a send-up, by the way...

A note on piffles by A. B. Smith

A. C. Jones in his paper "A Note on the Theory of Boffles," Proceedings of the National Society, 13, first defined a Biffle to be a non-definite Boffle and asked if every Biffle was reducible.

C. D. Brown in "On a paper by A. C. Jones," Biffle, 24, answered in part this question by defining a Wuffle to be a reducible Biffle and he was then able to show that all Wuffles were reducible.

H. Green, P. Smith, and D. Jones in their review of Brown’s paper, "Wuffle Review, 48", suggested the name Woffle for any Wuffle other than the non-trivial Wuffle and conjectured that the total number of Woffles would be at least as great as the number so far known to exist. They asked if this conjecture was the strongest possible.

T. Brown, "A collection of 250 papers on Woffle Theory dedicated to R. S. Green on his 23rd Birthday" defined a Piffle to be an infinite multi-variable sub-polynormal Woffle which does not satisfy the lower regular Q-property. He stated, but was unable to prove, that there were at least a finite number of Piffles.

T. Smith, L. Jones, R. Brown, and A. Green in their collected works "A short introduction to the classical theory of the Piffle," Piffle Press, 6 gns., showed that all bi-universal Piffles were strictly descending and conjectured that to prove a stronger result would be harder.

It is this conjecture which motivated the present paper.

.................

Not to be outdone, S. J. Farlow from the Department of Mathematics, University of Maine, wrote in the seminal A rebuke of A. B. Smith's paper, 'A Note on Piffles':

In A. B. Smith's recent paper, 'A Note on Piffles', The American Mathematical Monthly, 84, p. 566 he completely fails to mention one of the most significant results yet discovered in Piffle Theory, namely A. K. Puddle's paper, 'Products of Planar Piffles'.

In this short but succinct note Puddle proves that a denumerable product of Pi Piffles is in fact a P-Pi Piffle (assuming of course pairwise permutation of the Piffles). That Puddle's condition was only necessary and not sufficient did of course not detract from this significant work—but did in fact open the door to the well-known Piffle Paradox (of which I'm afraid Professor Smith is completely unaware).

Readers interested in obtaining a complete up-to-date history of the Piffle should consult P.U. Piper's comprehensive review, The Piffle: 1840-1978 (Pauper Press). Here Piper describes some modern approaches taken by American Mathematicians during the last fifteen years. I am sorry to say that the classical treatment of Piffles taken by most English Mathematicians, notably the work of author Smith, is, by American standards, obsolete even before it hits the printing press. In particular the classic theorem of Smith, Jones and Brown on Polynomial Piffles would be only a simple corollary to Puddle's basic result on Homological Piffles. In fact it is fairly safe to say that all the English results so far on Piffle Theory can be subsumed in Piper's short note, 'Spectral Decompositions of Partial Piffles', American Piffle Review, 27, pp. 1-2.

.................

Hat-tip to Let ε < 0 where I first saw this lovely work. I believe the original paper came out of discussions between mathematicians and educators regarding good (and presumably bad and confusing) forms of mathematics education. I dare say that had I seen this treatise in undergraduate maths, or had Homological Piffles been mentioned at least once, I wouldn't have transferred from Metric Spaces to Astronomy....

References:
Austin, A. (1967). 3183. Modern Research in Mathematics The Mathematical Gazette, 51 (376) DOI: 10.2307/3614400

Farlow, S. (1980). Three Mathematical Satires A rebuke of A. B. Smith's paper, 'A Note on Piffles' International Journal of Mathematical Education in Science and Technology, 11 (2), 285-304 DOI: 10.1080/0020739800110222

Tuesday, 19 October 2010

Ep 136: Sexual Selection


It's about time we put out a new podcast!

In this edition, I chat to Associate Professor Robert Brooks, Director at the Evolution and Ecology Research Centre, UNSW about sexual selection.

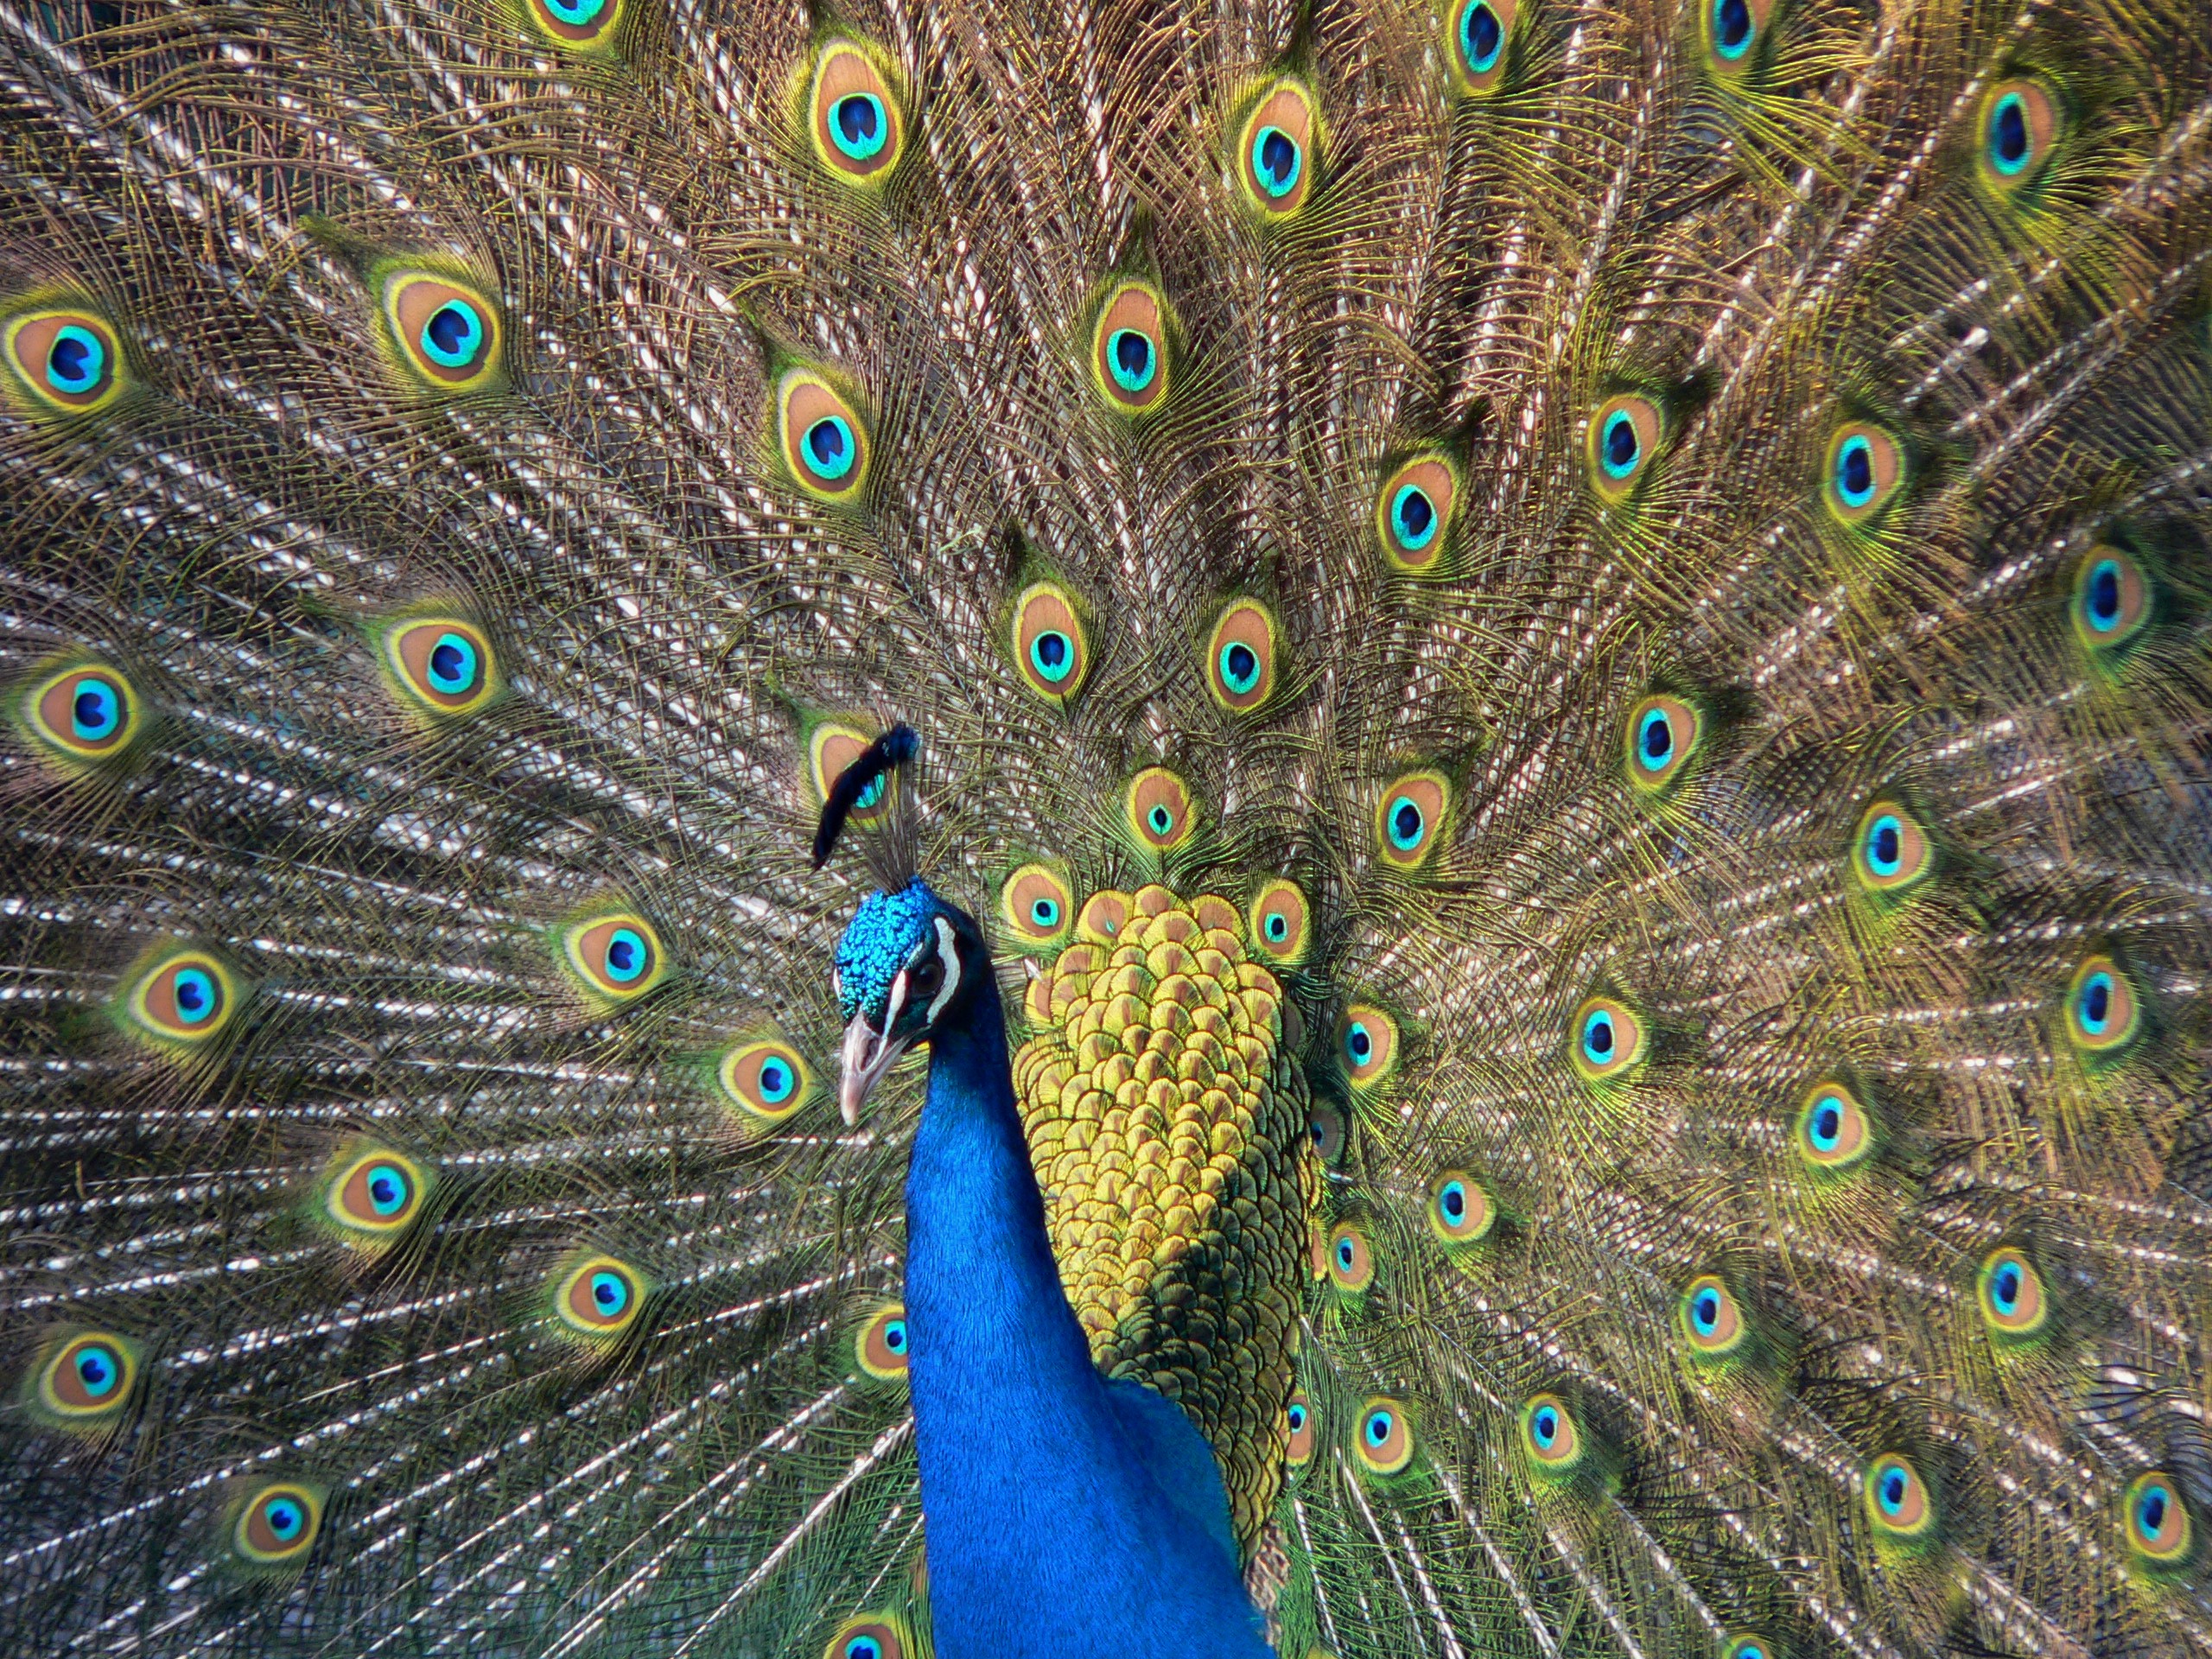
Charles Darwin described sexual selection as "struggle between the individuals of one sex, generally the males, for the possession of the other sex" and nature abounds with strange examples of where animal features have evolved way past their survival needs - for example, reindeer antlers, peacock plumes and quite possible human vocabulary - humans and other primates survived quite nicely without a wide vocabulary, why do we now possess one?

Rob is a leading world expert in the area, listen in to find out what he had to say.
Listen in to this show here (or press play below):


If you would like to hear more about the science of sex, check out The Beer Drinking Scientists episode Let's talk about sex.

References:
Brooks, R. (1999). The dark side of sexual selection Trends in Ecology & Evolution, 14 (9), 336-337 DOI: 10.1016/S0169-5347(99)01689-4

Brooks, R., Hunt, J., Blows, M., Smith, M., Bussiére, L., & Jennions, M. (2005). EXPERIMENTAL EVIDENCE FOR MULTIVARIATE STABILIZING SEXUAL SELECTION Evolution, 59 (4), 871-880 DOI: 10.1111/j.0014-3820.2005.tb01760.x


Monday, 11 October 2010

2SER Subscriber Drive - subscribe and I will give you a cuddle


Between October 11 and October 23, Sydney community radio station 2SER is running its annual subscriber drive. 2SER is home to the science program Diffusion Science Radio to which I regularly contribute, and I also record interviews and podcasts using their studios.

Community radio stations are partially funded by various levels of government, but in the main, they draw their revenue from sponsors and listeners. Subscribing to 2SER is pretty cheap:

$33 - Concession
$66 - Working
$120 - Passionate
$120 - Bands / Artists
$120 - Organisation
$250 - Business
$600 - Lifetime

The theme for this year's drive is Hello Radio, my old friend - so go on, help out a friend in need! Check out the subscriber page to contribute and for more information on the subscriber packs that will be delivered to your door, and the prizes you could win, should you subscribe.

Subscribing to 2SER helps keep independent radio on air - for instance, you will be hard pressed to find quality science radio in Australia outside of the ABC - generally, community radio stations house this type of broadcasting. And as Diffusion is a relatively small operation, we can respond to listener questions in a personal way. Each member of the team is an actual trained and working scientist, as opposed to a journalist, which means that we can bring authority to the topics at hand, as well as having access to Australia's best scientists. The same can be said of 2SER's other talk shows.

To the freebies - if you subscribe, you will receive:
  • Spunk Subscriber Pack containing tracks from Bear Hug, Menomena, Holly Throsby, Sufjan Stevens, Wild Nothing, Caitlin Rose, Active Child, Sonny and the Sunsets, The Books, Olof Arnalds, Mountain Man, Joanna Newsom, Gold Panda, Anthony and the Johnsons plus Jeff The Brotherhood;
  • Three months subscription to Time Out Sydney:
  • Sticker, Fridge Magnet.
The major prizes are:
  • Return flights To Malaysia for two - valued at $1890;
  • A $1000 bike pack;
  • A 12 month membership to Boxing Works, Surry Hills - valued at $1308;
  • 12 months of music - valued at $1440;
  • 2 courses at 2SER School Of Radio - valued at $1320;
  • A DJ course and music production course with DJ warehouse - valued at $540;
  • Oxx Digital and Internet radios - valued at $300;
  • 10x Double Passes To Peats Ridge 2010/11 - Valued At $600.
Plus, if you subscribe and mention Diffusion (or, if you want, me!) then I will give you a cuddle. What more could you want? Check out the subscriber page for more.

Tuesday, 28 September 2010

How close could an average spaceship get to the Sun before melting?


I must start by apologising for being so lax in posting articles and podcast episodes over the last month. We've recently bought a house and moved in, and this process has taken up nearly all my time, given me multiple headaches and left me without the Internet at home.

A while back we put a call out for your burning science questions, and plenty of great questions came in on this site, via email, on twitter (@westius) and over at facebook. I apologise for my delays in publishing these questions and their answers - you can follow the questions that have already been answered in the podcast or on the blog using the Science Week tag.

One interesting question that came in was How close could an 'average' spaceship get to the Sun before melting? Here is an answer from a much more intelligent person than I, Physics PhD holder and all round good bloke, David Bofinger.

An old-fashioned spaceship would probably be made of aluminium, a more modern one might be made of a mixture of aluminium, graphite fibre and polycyanate. Assuming you want the spaceship to actually melt, rather than just fall to bits because a few bits melted, then you probably want to raise it to the melting point of aluminium, which is 933 Kelvin. Of course it will take a lot less than that to kill any crew and cook any electronics on the ship. But melt you asked for and melt we shall give.

We'll assume for the moment that the spaceship is a simple sphere and that we haven't done anything clever to keep the spaceship cool. It will heat up to a temperature such that it's radiating away as fast as it's absorbing heat from the sun. The closer it gets to the Sun the more it absorbs, the more it needs to radiate so the higher its temperature will get.

If we put it in orbit around the Earth, then it's about 150 million kilometres from the Sun and the temperature it reaches is 279 Kelvin, i.e. about 6 degrees Centigrade. (Earth is mostly warmer than this because it has greenhouse gases in its atmosphere.) To melt the aluminium in the spaceship we need to take it into 13 million kilometres, about a twelfth of the distance from Earth and four times closer than Mercury.

Of course there's all sorts of tricks we can play to get closer. We can make the spaceship silvery on the side facing the Sun and black on the side facing space. That will make it absorb less and radiate more. If we made it as white as snow on the Sun side and black as coal on the space side then we could get in as close as 6 million kilometres, about eight times closer than Mercury and twenty-five times closer than Earth. If we made the spaceship long and thin and pointed it toward the sun we could maximise our ability to dump heat compared with how much we absorbed. That might get us in a little close yet. If we pull out all the stops we might do as well as NASA's planned solar probe, which intends approaching within 6.6 million kilometres of the sun while staying cool enough to have functional electronics and cameras.

The moral is that if you want to go close to the sun you don't want an average spaceship, but something built to take the heat.

If you have an alternate opinion, I'd love to hear it.

Monday, 6 September 2010

Dodgy cricket odds

The cricket world has recently been rocked by allegations of match-fixing against the Pakistan team.

The News of the World set up a sting to catch sporting-agent Mazhar Majeed correctly predicting when three no-balls would be bowled during the recent Lords Test Match between England and Pakistan. Whilst this in itself is not match-fixing (it's called spot-fixing - fixing certain events in a days play to win exotic bets), it's a smoking gun pointing towards further corruption.

So what are the odds of correctly picking three no-balls in a day's Test play? Could Majeed have just been lucky?

Let's assume there are 90 overs in a day's play, and on average 10 no-balls and 3 wides. This means that 553 balls will be bowled in the day. There are two ways to work out the probability of correctly choosing 3 balls as no-balls.

1) You can choose 3 random balls from 553 in 28032676 different ways. You can choose 3 no-balls out of 10 possible no-balls in 120 different ways. So mathematically, this looks like:


2) The other way to do this to imagine a big bag of marbles, where the no-balls are black and all other balls white. The first time you pull out a marble, you have 10 chances in 553 of pulling out a black marble. On the second draw, you have 9 chances in 552 and on the third you have 8 chances in 551. This looks like:


This means there are 4 chances in a million of the sports-agent fluking his result. Essentially, he's dodgy! (It is left as an exercise for the reader to prove algebraically that the above two methods are exactly the same...)

Further reading:
Forrest, D. (2003). Sport and Gambling Oxford Review of Economic Policy DOI: 10.1093/oxrep/19.4.598
Frey, James H. (1992). Gambling on sport: Policy issues Journal of Gambling Studies DOI: 10.1007/BF01024122

The Beer Drinking Scientists talk Sex

Over at my other podcast, The Beer Drinking Scientists, we like to tackle the big science topics down at the pub. And what better topic to talk about over a beer than sex?

Darren and Marc review the history of research into sexuality, including the seminal Kinsey Reports, the Masters and Johnson research into the diagnosis and treatment of sexual disorders and dysfunctions, and the more recent, and intriguing, study that Partner wealth predicts self-reported orgasm frequency in a sample of Chinese women.

We also take a look at how sex might have evolved. Why is it that it takes two people to have sex? Wouldn’t evolution be quicker if we could simply reproduce on our own? This is known as the twofold cost of sex - what are the benefits of having two people mix their genes to reproduce? Sexual Selection is another topic up for discussion. Charles Darwin described sexual selection as “struggle between the individuals of one sex, generally the males, for the possession of the other sex” and nature abounds with strange examples of where animal features have evolved way past their survival needs - for example, reindeer antlers, peacock plumes and quite possible human vocabulary - humans and other primates survived quite nicely without a wide vocabulary, why do we now possess one?

We could not possibly tackle this topic without discussing the Sexy Son Hypothesis, or without having a chat to the punters in the pub. Tune in to hear the public’s thoughts on sex, the science involved, length, width, money, style, cuteness, attraction and also hear Darren provide solace to a broken hearted drinker.

Of course, over a beer, much is talked about and you’ll have to tune in to catch the rest! Get over to The Beer Drinking Scientists website to subscribe, listen in to this show here, or press play below:


Wednesday, 25 August 2010

Ep 135: Why do I sneeze at the Sun?

Do you sneeze at the Sun?

I do. My brother does. Both my parents do. In fact, we are a family of Photic Sneeze sufferers.

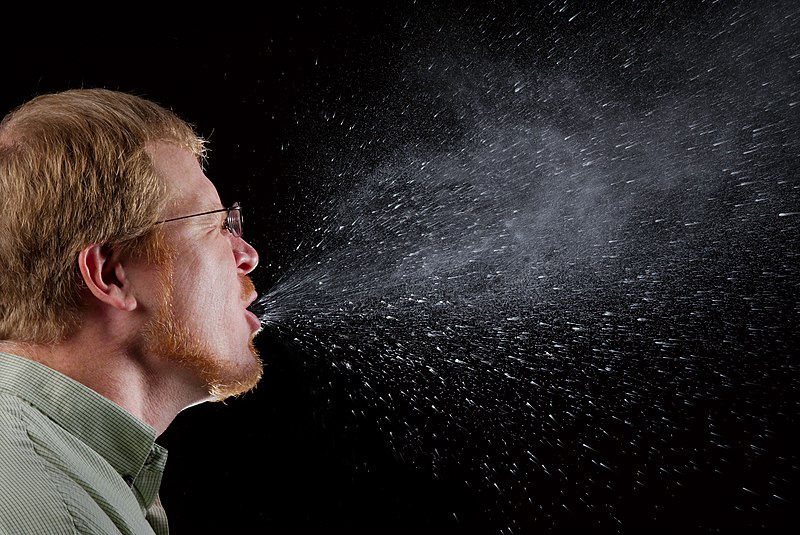
The Photic Sneeze Reflex (PSR), also known rather ridiculously as Autosomal Dominant Compelling Helioophthalmic Outburst (ACHOO) Syndrome (how long do you think it took researchers to figure out that acronym....) is a dominant genetic condition affecting around 10% of the population. When a sufferer moves from a region of darkness to a region of bright light - for instance, walking outside and looking at the Sun - multiple sneezes occur. Research into the disorder has yet to explain either its mechanism or an evolutionary reason for why it occurs. One theory is that there is a "short circuit" in the brain, with the stimulated optic nerve somehow triggering the sneeze reflex.

Professor Louis Ptáček runs the Laboratories of Neurogenetics at the University of California, San Francisco. The aim of the lab is to study familial disorders with strong genetic contributions, and thus localise and identify genes that cause human disease. Other conditions in which he is interested include migraine and epilepsy, and an intriguing condition whereby certain sounds cause seizures. He considers PSR to generally be a midly annoying condition, unless you are a combat pilot, where sneezing at the Sun could indeed be life threatening.

I had a really interesting chat to Louis about PSR, and I've left the recording a little longer than usual, as we were really able to explore some fascinating ideas involved with PSR - it was a great chat. Listen in to this show here (or press play below):


Other interesting write-ups of PSR include neurotopia and Scientific American.

This topic came in as part of my call for questions for Science Week, so thanks @lisushi for the question! I'll be putting up more blogs and podcasts to answer the other questions that came in over the next few weeks.

References:
Breitenbach RA, Swisher PK, Kim MK, & Patel BS (1993). The photic sneeze reflex as a risk factor to combat pilots. Military medicine, 158 (12), 806-9 PMID: 8108024 

Langer N, Beeli G, & Jäncke L (2010). When the sun prickles your nose: an EEG study identifying neural bases of photic sneezing. PloS one, 5 (2) PMID: 20169159 

MADIGAN, J., KORTZ, G., MURPHY, C., & RODGER, L. (1995). Photic headshaking in the horse: 7 cases Equine Veterinary Journal, 27 (4), 306-311 DOI: 10.1111/j.2042-3306.1995.tb03082.x

Songs samples in the podcast:
The Steve Wilson Band 
"Stare At The Sun"
from "Sideshows And Fairytales"
Buy at iTunes
DJ Smiths vs Markanera
 "Watching the Sun Goes Down"
from "Watching the Sun Goes Down"
Buy at iTunes
Alexis Cuadrado 
"Bright Light"
from "Puzzles"
Buy at iTunes