Another version of the problem considers a lost e-mail somewhere on the Internet. The sender wants to make sure it is delivered to the right place, no matter where it already is. Read more.
Thursday, 29 January 2009
Ep 98: Santa Claus - a fat, diabetic substance abuser?
Australian science writer Bianca Nogrady assembled a crack team of health experts to look into the state of the big man, and the prognosis wasn't good.
However, there were some up-shots, despite the likelihood of a cirrhotic liver. Due to the fact that he compiles the naughty/nice list each year, at least his mind is active and healthy. And he gets out of the house and travels - another plus for the elderly.
Our conclusion in the end is that Santa Claus probably has some kind of substance abuse problem to keep him going all Christmas Eve and to keep him jolly.
You can read more about the findings of the Santa-team in Bianca's original article for Australian Doctor, Health alert for Christmas visitor.
Listen to his podcast here:
Friday, 23 January 2009
New Scientist Relaunch

Last night I attended a function for the 2009 relaunch of science magazine giant New Scientist. These types of events are always nice - free food and drink, a chance to mingle with interesting people and the opportunity to play 10-pin bowling on their Wii. A few big names in Australian science communication were there - for example Karl Kruszelnicki, Wilson da Silva, Leigh Dayton and Bianca Nogrady - and in general I thought it was a good night. The things I learnt were:- The new New Scientist looks quite a lot like the old New Scientist. In fact, with regard to the print edition, I probably wouldn't have known it was any different if I hadn't been told. However, their new website looks very nice and seems to be much easier to navigate - I found their old website quite difficult to get around and would often not be able to find articles that I knew were there;
- Much of the content in the Australian version of New Scientist is written in the UK. The employees of New Scientist who I met were generally in advertising or marketing. This meant I couldn't really smooze them into publishing any articles by me;
- The Australian Museum, where the event was held, has a magnificent view out to St. Mary's Cathedral and down to Woolloomooloo. Looks like a good venue for my 30th, if only I could afford it... I didn't bring my camera, but I had my phone for low-res photos;
- Not all science communicators wear loud flowery shirts - although a distinct fraction do. The wearing of such a shirt does not correlate with your ability as a science communicator, nor your ability to play Wii.
Saturday, 17 January 2009
Ep 97: My Top 5 Mathematics Stories from 2008
1) Solving Tough Modern Problems
Global Financial Crisis: Toxic loans? Greedy bankers? Or mathematics? What is to blame? Whilst the GFC is a very complex system that I won't get into too deeply, the backbone of the crisis lies in a few key points:- In the US (and in Australia), there is a very strong pressure to buy your own home. It's fuelled by the idea that housing prices never fall, low interest rates, ideas regarding how you must get into the housing market, and it's probably helped along by a current generation that doesn't mind a bit of debt, not to mention the ease at which you could get credit in the early 2000s. The problem with all this is that people who could barely afford loans tried to get them, and....
- .... the banks happily gave them loans. Once housing prices started to fall, people had mortgages bigger than the value of their homes. These sub-prime loans failed to take into account that plenty of people could not afford to pay them back (they were sub-prime mortgage candidates). In the meantime....
- .... banks and other financial organisations were getting clever with their financial instruments and this is where some blame may lie with maths. Securities, backed by mortgage repayments, were repackaged as bonds and sold on to other banks, insurance companies, superannuation funds, governments, everyone. The credit derivatives market was huge! Once housing prices started to fall (housing bubble), people couldn't pay back their debts, the banks didn't get their repayments and this affected not only everyone who owned mortgage-backed securities, but everyone who traded with people who owned mortgage-backed securities. Given credit was so easy to get, this was nearly everyone. Companies such as Lehmann Brothers started to fail and governments had to jump in to bail them out.
I was astonished to hear a finance graduate friend of mine reflect on her time studying finance at University:
"The lecturer put up an equation, the theatre moaned, but the lecturer said 'Don't worry, this is the only equation in the course and you don't even need to know it'."
I seriously hope that's not typical! There is a very interesting podcast on this topic produced by the BBC program Discovery. One of the interesting things they talk about is that it is very hard to mathematically model the human elements of the system - we aren't atomic particles that can be modelled. Read more here on Plus and here on More or Less, and see Flowing Data for a visualisation of the crisis.
Climate Change and Terrorists: 2008 saw the first meeting of the Cambridge Complex Systems Consortium. "This multi-disciplinary team of Cambridge-based academic and industry leaders aims to study complexity across multi-dimensional domains," says Michelle Tuveson of Lockheed Martin UK, who is an associate of Clare Hall College and organised the meeting. "We aim to develop a science around complex systems by determining good frameworks, optimisation strategies, and prioritisation schemes." Issues involving complexity include climate change, terrorists and modelling of the Internet. Read more.
2) The end of a mathematical era
Walter Warwick Sawyer was a mathematician and author who made a major contribution to mathematical education. He recently passed away in Canada, aged 97. Sawyer was born in 1911 and was interested in the applications of mathematics to industry. He developed a scheme in which apprentices learnt mathematics by handling physical objects and in 1943 published his first and most successful book Mathematician's Delight, which has been in continuous publication since and has sold about 500,000 copies. Sawyer was a loud voice criticising many aspects of mathematics education and considered that students taught mathematics without an appreciation of its application would have no more understanding of what they were learning than a machine. His love of mathematics is seen in the title of his first book, Mathematician's Delight, whose aim was to "dispel the fear of mathematics":
"Many people regard mathematicians as a race apart, possessed of almost supernatural powers. While this is very flattering for successful mathematicians, it is very bad for those who, for one reason or another, are attempting to learn the subject."
He considered that teachers should work with students' minds and talents, rather than force foreign concepts on them.
"Education consists in co-operating with what is already inside a child's mind... The best way to learn geometry is to follow the road which the human race originally followed: Do things, make things, notice things, arrange things, and only then reason about things." Read more.
3) Solving Tough Old Problems
Road Colouring Problem: Sixty-three year-old Avraham Trakhtman has solved one of the current generation's toughest mathematical problems — the 38 year-old road colouring problem. The road colouring problem, which was first raised by Israeli mathematician Binyamin Weiss in 1970, is a problem concerning synchronised instructions and is expressed simply:
L-functions underpin much of twentieth century number theory. They feature in the proof of Fermat's last theorem, as well as playing a part in the recent classification of congruent numbers, a problem first posed one thousand years ago. Read more.
One of the most important international prizes for mathematics was awarded jointly in 2008 to two outstanding mathematicians — even though one of them was originally unable to find a publisher for his groundbreaking work. Professor John Griggs Thompson, of Cambridge and Florida Universities, and Professor Jacques Tits, of the Collège de France, have been awarded the 2008 Abel Prize, worth £580,000, by the Norwegian Academy of Science and Letters "for their profound achievements in algebra and in particular for shaping modern group theory". Read more.
5) Silly Maths
If we are to believe the latest signs from outer space, the local aliens are keen mathematicians and work in decimal. A new crop circle appeared on the 1st of June 2008 in a barley field near Barbury Castle in Wiltshire, England, measuring 150 feet in diameter and correctly representing the first 10 digits of the irrational constant pi. Read more.
- No matter how many friends you have on Facebook and MySpace, you won't have more real-life friends than the average person. Using mathematics to model online social networks is an evolving field, with techniques that have been used to model human interaction, such as network modelling, moving into the online world. Users of online social networks tend to build up long lists of "friends" with whom they only occasionally interact, if at all. The existing techniques have now been used to model these weaker relationships. Read more.
Listen to his podcast here:
And remember to tell us your science highlights from 2008 to go into the running for some sciencey prizes. Answers will also contribute to our year-in-review podcast early in 2009. The comp will be open till 26 January. Let us know here.
Tuesday, 13 January 2009
Favourite Fictional Scientist - End of Poll
Doc Emmett Brown from Back to the Future. Doc Brown came in with 23% of the vote, ahead of Beaker and Honeydew from The Muppets with 13%.
If you'd like to see the full results, get over to the original poll post (simply click View Results on the poll). There you can also hear the podcast I put together with "The Ordinary Guy" from the Brains Matter podcast about fictional scientists.
Thanks for voting!
Friday, 9 January 2009
Science, Psychology and Cricket

Every cricket season, the TV coverage of cricket becomes more spectacular and technological, with the introduction of microphones to detect the finest of edges through to the keeper, improved abilities to determine the trajectory of a ball once it has left the bowler’s hand, and now even heat sensors to see how the batsman sweats.
But the scientific aspects of cricket are not limited to TV companies, with science playing an increasing role in shaping the performance of players, from their general fitness to specific training techniques for both their physical, and possibly more importantly mental, well-being.
It is with science that countries are aiming to find the competitive edge.
Are cricketers fit?
If you’ve watched the likes of Ian Botham, David Boon and Darren Lehmann strut the international cricket stage, you might believe that you really do not need to be that fit to play cricket.
Studies conducted by Dr Rob Duffield at the School of Human Movement at Charles Sturt University, and Dr Marc Portus, the Sports Science Manager of Cricket Australia, have found that indeed you really do not need to be as physically fit to play cricket as you do other sports such as football.
However, you do need to be psychologically strong, have a level of endurance and recovery, and plenty of natural talent.
During a test century, which takes on average three and a half hours, a batsman will stand still for two hours, walk for an hour, jog for ten minutes, spend only five minutes running hard, and about a minute and a half sprinting.
“Physical conditioning and muscle training is not going to necessarily improve your performance in cricket,” Dr Duffield said. “Having a high oxygen consumption or a faster twenty metre sprint time doesn’t mean you are going to be able to bowl better, or get more wickets, or score a century.”
This does not mean, however, that you can be completely unfit and compete at the highest level. The fitter you are, the less likely you are to succumb to injury, and the quicker you recover from fatigue.
Dr Portus said that this work would feed into the coaching regime for Cricket Australia,
“We need to understand the requirements of elite international cricket a whole lot better, particularly with our fitness training program.”
It seems the key to being a good cricketer is lots of net practice to keep the skill base high, natural talent – something perhaps with which you are born – and the ability to tackle the psychological aspects of the game.
How do world-class cricket batsmen anticipate a bowler's intention?
According to folklore, cricket is 90% a mental game.
Independent studies by Alistair McRobert from Liverpool John Moores University in the UK, and Dr Sean Müller from RMIT University in Australia, have both concluded that the very best batsmen can predict the sort of ball they will receive even before the ball leaves the bowler’s hand.
The research programs were conducted in parallel without feeding into each other, suggesting that it is with such scientific studies that countries are looking to find the edge.
The programs, conducted for the ECB by McRobert and published in the Quarterly Journal of Experimental Psychology by Müller, state that mediocre batsmen do not pick up on the subtle clues given off by a bowler, showing that perhaps the importance of psychology in cricket is even deeper than we might have first thought.
Whilst a lesser batsman will only make his decision about where the ball will land once it is in flight, or will perhaps make an early faulty call, an experienced player can start this decision-making process earlier, giving him more time for shot selection – very important if you’re facing Steve Harmison or Brett Lee.
McRobert’s study found that skilled batsmen pick up information from the bowlers “central body features (head-shoulders, trunk-hip)” and less skilled batsmen rely on clues in the bowler’s hand and ball position. The Australian study found that “highly skilled players demonstrated the …unique capability to pick up advance information from some specific early cues to which the less skilled players were not attuned.”
Both experiments were conducted on elite players – in Müller’s case, the Australian cricket team – and then repeated on intermediate and novice cricketers.
One test involved showing the participants a video of a bowler running in from the batsman’s perspective, and stopped the video at various points so that the batsman could make a prediction about what might happen next. McRobert’s tests also focused on the eye-movements of the batsmen using head mounted optics and high speed cameras to try and understand the subconscious decision making of the batsman.
The research has the potential to allow coaches to understand how body language is communicated. McRobert’s study suggests that experience against all types of bowlers is also important.
“Our research revealed that a batsman uses different search strategies when facing fast and spin bowlers… It is important that information relating to potential visual cues is specific to the type of bowler.”
The work also suggests that match context determines how a batsman makes his decisions, and so coaching sessions could be designed to focus on the aspects of the game that play with the mind, rather than aspects of a batsman’s technique.

Psychology on the field
According to Justin Langer’s blog, sports psychology is “the least studied of all cricket skills, even if it is widely accepted as being the most important ingredient of success.”
But this is starting to change, with most teams having associated psychologists. The ECB is currently in the process of appointing a National Lead Psychologist, and have used psychologists Dr Wil James and Dr Steve Bull on a part time basis.
Dr James, who provides psychological services for the ECB up to the Academy and England-A levels, as well as for overseas touring age sides, says that his role is to help players develop their mental game so to deal with setbacks, and also to help players raise their mental games.
The aim is to work with coaches to “foster development of a strong mental game by consulting upon, rather than taking over, player development.”
“The aim is to develop the coaching environment.”
This developing coaching environment is gradually starting to take effect, not just at the elite level, but also at lower levels, with each county academy having an associated part-time sports psychologist. Dr James says that eventually the aim is to have sports psychologists associated with teams on a more full-time basis with a strategic outlook on player development.
“Psychology is not a quick fix.”
Dr James thinks psychology has a strong role to play in allowing the coach to “coach in a way that asks questions of players, not just answers them. We want to challenge players, and take them out of their comfort zones.”
This is important when viewing the way that many junior players find their way to the top, with many unprepared for the mental game.
“Sports psychology helps coaches select players, not just on technical ability, but also mental characteristics. It helps the coach nurture natural talent. Some players may have tonnes of natural talent but never have been challenged, whilst others might have shown that they can bounce back from a setback.”
Research is being conducted within the ECB to develop an assessment tool to categorise different types of “mental toughness”. This research looks at factors such as emotional intelligence, and again helps coaches identify players that have the mental edge. Some players have the ability to maintain their confidence throughout a period of misfortune, and being able to identify this helps coaches work with those that may not have this ability.
“The aim is to make players focus on what they can do, not what is affecting them.”
Warren Frost, Sports Science and Medical Coordinator for New Zealand Cricket (NZC) said that NZC has psychological programs in place, although he admits that “there has not been a lot of publication on the psychological demands of cricket.” New players go through psychological “programmes of development in the same way that skills or fitness are developed.”
“(Psychological coaching) is individualised and run by our sport psychologist in one on one situations as required”
When asked if New Zealand had come up with a way tackling performance momentum – for instance, getting a team “up” for a dead rubber in a series – he commented:
“One of the eternal questions of any sport!”
It may take some time before science answers that one.
Psychology off the field
Promoting the visualisation of positive scenes, such as run-scoring or wicket-taking moments, has become part of the coaching manual thanks in part to scientific research. Notably, Langer’s long-time batting partner Matthew Hayden sits on the pitch before each innings visualising how he will bat.
The understanding of positive visualisation has arisen from scientific work into depression, and apart from on the field, wear and tear on the mind can have an effect off the field. English opening batsman Marcus Trescothick is the most recent example of a high profile cricketer struck down with a stress-related illness. The frenetic and grinding itinerary and lifestyle of an international cricketer is often incompatible with their personal make-up or home life.
There is a growing realisation within society that depression and mental illness are serious problems that cannot be glossed over. It poses the question then, how do coaching staff and team management best nurture players who may be vulnerable to this type of illness?
One promising acknowledgement of the problem is from the Professional Cricketers’ Association (PCA), which offers free counselling sessions to all current cricketing professionals from any phone in the world. The hotline is manned 24-hours by experienced, professional counsellors. They have also set up the Benevolent Fund, to help cricketers adjust to life beyond cricket.
This is a positive development by the ECB, as it is often difficult for players to adjust to life after cricket having had their identity tied to it for many years. Silence of the Heart, by David Frith, details over 150 professional cricketers who committed suicide, mostly after their retirement.
The ECB has also set up the “Performance Lifestyle Service” to help players throughout their careers, and prepares them for life after cricket. A network of clinical psychologists is maintained for cricketers who face problems such as addiction or depression.
Science and Medicine in Cricket Conferences
The psychological aspects of the game are now making up part of various sports science conferences. The increasing role of science in cricket has been highlighted in the last decade through the four-yearly World Congress of Science and Medicine in Cricket, held in conjunction with each World Cup. The first congress in 1999 had 50 attendees, with representatives from Australia, New Zealand, South Africa, Zimbabwe, the West Indies and the UK. In 2003, the congress reflected the growing stature of science in the game with 119 attendees, including representatives from Canada, India and Pakistan. Barbados played host to the 2007 version, with the majority of presentations coming from Australia, the UK and South Africa.
Craig Ranson, England Cricket Board Lead Physiotherapist at the National Cricket Academy, said that the programme was wide ranging, including fields such as Sports Medicine and Rehabilitation, Injury Surveillance and Prevention, Sports Biomechanics, Exercise Physiology, Nutrition and Hydration, Thermoregulation and Motor Learning.
“It was clear that although there was some good science presented the overall goal was to produce research that resulted in a performance advantage.”
Recently, the 2007 Cricket Australia Sport Medicine Conference was held, with presentations from the then Australian coach and noted cricket analyser John Buchanan, and papers ranging from the effects of alcohol, heat and humidity on athletic performance, to evidence from baseball that umpiring decisions are influenced by game context, kinematic analysis of the doosra and off-break, and why fast bowlers bowl no-balls.
National Programs
A number of countries now have dedicated centres for scientific input into cricket. The ECB has set up the Science and Medicine Management Group to “continually review the best strategic approach for the delivery of all science and medicine support for cricket,” whilst Cricket Australia has set up the Sports Science Program to leverage off the expertise of the Australian Institute of Sport (AIS).
Carl Petersen works with the AIS to track the workload of cricketers using GPS technology, and says that Cricket Australia has recently offered two PhD scholarships in Physiology and Performance Analysis:
“The first scholarship focuses on utilising in-house developed GPS devices combined with micro-sensors to accurately define workload in cricketers. With a better understanding of cricket workload and demands, our strength and conditioning coaches will be able to design more effective training programmes, and monitor recovery more precisely to have the cricket athletes peaking on game day(s),” said Petersen
“The second PhD is focusing on the developmental training pathways of fast bowlers.”
Additionally, Cricket Australia has a research programme investigating the biomechanics of cricketing skills. Wayne Spratford runs a number of tests for Cricket Australia:
“Over the last two years we have developed skill based tests for batsmen, bowlers and fielders which we have implemented on all levels of cricketers in Australia from the Test team to State Under 17 level.”
Both commented that much of their work is kept in-house to maintain a “competitive advantage”.
The competitive edge comes not from what is done on the field, but what research is done off it.
Future
So where to now for science and cricket? Whilst some countries are embracing the concept, developing cricketing countries do not have the resources for scientific cricket analysis.
One recent development has been the Nike Air Zoom Yorker shoe, developed for New Zealand cricketers by the University of Auckland alongside clothing company Nike.
And it has been suggested by Shri. V. Srivata, former Chief Sports Editor for The Times of India, that courses in the science of cricket become mandatory for all cricket coaches.
Whoever said cricket was a simple game?
Wednesday, 7 January 2009
Ep 96: Reflecting on the science year 2008
This week I sat down with a kebab and Darren Osborne, editor of ABC Science Online, to reflect on the science year that was 2008. Darren was immersed in science in 2008 and is across nearly all the science topics that hit the headlines - as well as breaking the science news himself. Topics we discussed include:- Climate Change;
- The LHC;
- X-rays and Sticky tape;
- Genomic Research;
- Biofuels and the food crisis;
- Alternative Energy Sources;
- Beer made from 45 million-year old yeast;
- A 380-million year-old fossilised fish, which was in the process of giving birth;
- The Sumo Diet.
Listen to his podcast here:
And remember to tell us your science highlights from 2008 to go into the running for some sciencey prizes. Answers will also contribute to our year-in-review podcast coming out in a few weeks. Let us know here before the competition closes.
Wednesday, 31 December 2008
Ep 95: Merry Christmas from Mr Science!
Reindeer and Santa Claus are the topic of this week's Mr Science Show. With Christmas here, we thought we'd look at some Christmas news, and this week we take a look at reindeer facts and the problems Santa is having at the North Pole. Due to global warming, and the global financial crisis, Santa has had to put his North Pole residence up for auction and is currently looking for a new place in Lapland.Merry Christmas from the Mr Science Show!
Listen to his podcast here:
And remember to tell us your science highlights from 2008 to go into the running for some sciencey prizes. Answers will also contribute to our year-in-review podcast early in 2009. Let us know here.
Tuesday, 30 December 2008
The curse of the duck
The recent news of the great Indian batsman Sachin Tendulkar surpassing West Indian Brian Lara's record number of test runs has given maths-loving cricket geeks another opportunity to pull out their calculators and Excel spreadsheets. I'm openly one of these nuts and did just that.
At the time of writing, Tendulkar had scored 12,027 runs across 247 innings, to overtake Lara's 11,953 from 232 innings. After a little investigation, I found that despite his outstanding average of over 54 runs per innings, Tendulkar's most common score in test cricket is ... zero!
This was quite a shock — the most prolific run-scorer in test cricket has been out for nought (a duck in cricket parlance) 14 times, well ahead of his second most common score — which incidentally is the next lowest you can get: one!
This is completely counter-intuitive, so I took this investigation further. Australian cricketer Sir Donald Bradman is universally regarded as the best batsman ever to have played the game. His average, an astounding 99.94, is so far above every other batsman in the history of the game that he is often acclaimed as not only the best cricketer ever, but the best player ever of any sport. His average is so iconic in Australia that the postcode of the ABC (the Australian version of the BBC) is 9994 in every capital city. If it wasn't for the fact that much more test cricket is played nowadays than in the early 1900s, and for World War II interrupting his career for six years, Bradman would have scored many more than the 6996 runs he did score.
So, guess what Bradman's most common score was?
That's right, zero!
Indeed, looking at every innings by the most prolific batsmen in test history from Tendulkar at number 1 to Bradman at number 34, the most common score is zero — and by quite a long way too. The following figures show the distribution of scores from these top batsmen — on the horizontal axis you see the number of runs and the vertical axis measures the frequency of dismissals at a particular number of runs. The first chart shows every score between 0 and 100, and the second uses five-run wide bins to show scores up to 250. The data only include scores where the batsman was dismissed and so does not include not-out scores.
Scores plotted against dismissal frequency.
Scores in bins of five plotted against dismissal frequency.
Model cricket
A closer look at these distributions shows that they very closely fit what is known as an exponential distribution. An exponential distribution has the form
|
In this case y is the probability of being dismissed at score x with λ being constant.
A common trick when looking at distributions involving exponentials is to take logarithms of both sides to get
|
The graph of this function, plotting ln(y) against x, is now a straight line with slope -λ. If the statistical data fits the exponential distribution, then the plot of the logarithm of the frequency of dismissals against the score at which dismissal happened should look roughly like a straight line.
A straight line fitted to the data. The blue dots represent observed data and the black line represents the model.
A straight line fitted to the data from the second chart above. The blue dots represent observed data and the black line represents the model.
The mean of an exponential distribution, a sort of average, is 1/λ. In our case this gives a mean of around 43 - the same as we observe in the raw data. One can make the interesting observation that there is no such thing as the "nervous nineties": players do not "choke" and get out in the 90s, nervous before scoring a glorious test century, any more than they get out at any other score. Indeed, you could argue the opposite given the probability troughs at 94, 98 and in the 190s. You can also see that the probability of being dismissed for a duck is higher than you might expect for an exponential distribution.
So what?
Now, so far you might be thinking that all of this is only of passing statistical interest. So what if cricket scores follow an exponential distribution? Well, I'm glad you asked!
Let’s turn for a second to a different distribution, the geometric distribution. You will be familiar with this distribution from a simple 50/50 coin toss. The geometric distribution describes the number of coin tosses you need before a head (or tail) first turns up. The probability of your first head turning up on your kth toss is described as
|
where p is the probability of a head turning up on each toss, that is, 0.5. The distribution is memory-less, which is one of its key descriptors. No matter what has gone before, even if you have fluked 100 tails in a row, the probability of a head turning up on the 101st throw is still p.
The geometric distribution only works for integer values of k, that is, you can only throw a coin 2, 3, 100 etc times and not 2.5 times. The exponential distribution is the continuous equivalent of this distribution, extending it to work for all numbers, not just integers. Given that cricket batting scores seem to fit a exponential distribution, this means that we can picture cricket batting scores on a geometric distribution with the probability of you being dismissed at score as
|
Can you spot the profound result here?
Remembering that the geometric distribution is memory-less, you can interpret this as saying that no matter what score you are currently on, you have the same chance p of getting out on that score as you do on any other score! Like a coin toss, the probability of you being dismissed on each score does not depend on what has gone before. A model which assumes that there is no memory is known as a constant hazard model.
This seems to go against every cricketing manual I have ever read. Accepted cricketing wisdom says that a batsman is more dangerous when (s)he "has the eye in" and has scored 10 or 20 runs. Our result seems to suggest that, apart from when a batsman is on 0, you have just as much chance of dismissing him or her on the current score as on any other score.
The next question to ask is, what is the probability of dismissing a batsman on the current score (that is, what is p in the above equation)? The mean of a geometric distribution is
|
Knowing that the mean of the exponential distribution is 1/λ, and transferring this to the geometric distribution, we get
|
For λ = 0.023 this gives p = 0.022. Therefore, if you were to turn the television on now and find the cricket coverage, the chance that the batsman you are watching gets out on the current score is 2.2%.
Scores near zero
The biggest deviation from the geometric distribution is for scores near zero. According to our data, the chance of being dismissed for a duck is 6.9% — around 3 times more than expected for a geometric (or exponential) distribution. But by the time the batsman has scored two or three runs, the geometric distribution starts to fit well. There is a small peak at four runs, perhaps because you can relatively easily get to four before you become comfortable — it only takes one streaky shot to the boundary. Whilst you can get to three with one shot, you are more likely to have played a few shots and so may be comparatively more "set".
The data and the geometric distribution. The blue dots represent observed data and the black line represents the model.
By assuming a constant hazard model, Brewer determined the effective average of a batsman before they have scored — that is, assuming a constant hazard model with probability p of dismissal equal to that of their chance of being dismissed for a duck, Brewer determined the mean of this new distribution.
In our data from the best batsmen of all time, dismissal for a duck occurred with a 6.9% chance. The mean of a geometric distribution built around this probability is
|
This means that even though our batsmen have a mean of about 43, before they've scored they bat like cricketers with a mean of 13.5. Even the best batsmen bat like tail-enders before they get off the mark!
Conclusions
What should we take away from this analysis?
The conclusion seems to be that there is a very small window in the beginning of a batsman's innings in which there is a greater chance of dismissal than there ordinarily is. This makes sense — batsmen take some time to acclimatise to the game conditions. But this is a small window — once the batsman has scored about three runs, you have the same chance of dismissal whatever the current score. Interestingly, tiredness does not seem to play a part — the exponential distribution holds well out to 250 runs (quite a few hours of batting).
It should be remembered that this analysis was completed on the top 34 run scorers of all time (5953 innings) and so represents the best ever batsmen. Lesser batsmen are likely to get low scores, so perhaps this window is slightly wider for them. But if we turn to the greatest of the great, Bradman, the window is essentially one run. His effective average before he had scored was a very mediocre nine runs. After he had scored two runs, this effective average had risen to 69. You had to get Bradman out very early!
More information
- The data was retrieved from cricinfo during the second test between Australia and India on the 19th of October 2008;
- Not-out scores were removed from the analysis;
- The exponential distribution does break down a little for scores above 250 as there simply isn't enough data;
- Yes, Marc has scored a duck in his cricket career.
Further reading
- Read Brendon J. Brewer's paper Getting your eye in: A Bayesian analysis of early dismissals in cricket;
- Find out more on the maths/cricket blog Pappus' plane — cricket stats.
- Of course, see Plus!
Monday, 22 December 2008
Ep 94: The Geek Pop Virtual Music Festival
Geek Pop is the world’s only sci-pop festival - a free online music event featuring songs about science. The festival brings together science-inspired artists from around the globe in a gleeful celebration of geek culture. In 2009, Geek Pop will take place between 6-15th March.This week on the podcast I spoke to Hayley Birch, the organiser of Geek Pop, about the festival, where the idea came from and what type of music we can look forward to.
You can subscribe to Geek Pop updates by sending an email to news@geekpop.co.uk with the subject SUBSCRIBE ME RIGHT UP. Or register your attendance at the Facebook event.
We've looked at the various scientific aspects of music in the past on Mr Science, just check out our music label.
Listen to his podcast here:
And remember to tell us your science highlights from 2008 to go into the running for some sciencey prizes. Answers will also contribute to our year-in-review podcast early in 2009. Let us know here.
Monday, 15 December 2008
Ep 93: Communicating Mathematics with the Masses
Some people find mathematics perplexing, whilst others find it beautiful. This week on the podcast, I spoke to two young men professionally employed to communicate mathematics to school-children around the country. Both these guys have a long history in science communication - I got to be good friends with them back in my science circus days.Jamos McAlester travels Australia with Tenix Questacon Maths Squad, which is an outreach program of Questacon – The National Science and Technology Centre. The Maths Squad aims to inspire students and teachers about maths, and show how science and technology, and in particular maths, play an important role in our everyday lives. The Maths Squad also offers professional development workshops for teachers. Initially started in 1976, it has now visited thousands of towns across Australia, and there aren't too many places in Australia that Jamos hasn't been. The program makes almost 500 puzzle-based activities accessible to students and aims to highlight the broad and narrative nature of maths and its essential and pervasive range of applications. Jamos has a particular love of maths and thinks that people often find maths boring because it is taught out of context:
Marcus Finlay is a proactive, scientifically inclined, primary school teacher from Melbourne. As opposed to most teachers, Marcus inspires his students about science and maths rather than running away from the topics, and lists his class's attempts to build model tsunamis in the classroom as his science highlight of 2008. Back in 2001, Marcus and I wrote The Marco Show about a couple of wizards who sung songs and turned themselves in dogs - you can read about this ridiculous show on Mr Science from 2006.
I spoke to Marcus and Jamos from The Mathematical Association of Victoria's annual conference, both were giving key-note addresses on the communication of mathematics.
Listen to his podcast here:
And remember to let us know your science highlight from 2008. You will go into the running for some sciencey prizes and we'll take a look at your highlights in a podcast episode in early 2009. See the form here.
Friday, 12 December 2008
What are your scientific highlights from 2008?
Whatever it is, let us know and everyone that writes in will go into the running for a prize. It'll be a good prize too - either some science magazines or books, something from the Mr Science store, or whatever I can get my hands on. Fill in the form below, leave a comment, or send us an email, and your thoughts will be included in an upcoming podcast reflecting on the science year that was.
THIS COMPETITION IS NOW CLOSED
Wednesday, 3 December 2008
Going mobile and QR codes

For those of you who need your content on-the-go, we've mobilised Mr Science. You can now see the Mr Science Show in a mobile phone compatible format at m.mrscienceshow.com. And for those of you with an iphone, we have made a site especially for you here. To create these sites, we used MoFuse.Mobile sites deliberately cut back on data rich content, so pictures are smaller and many of the other widgets, which are easy to download on your desktop but add up on expensive mobile data plans, are disabled. At the moment, as mp3s are disabled, if you wish to download the podcast, you need to do it through the normal desktop version of this site (which you can see on your mobile, but contains all the data-rich stuff). I would like to make it such that if you visit Mr Science on your mobile, your phone immediately redirects you to the mobile site, but alas there is no way yet to do that (well not in blogger, there is for wordpress blogs).
QR CodesQR Codes (Quick Response Codes) are two-dimensional bar codes (like the one on the left) originally developed by Japanese company Denso-Wave. Having just been to Japan, I can assure you they are very popular there. They are similar to normal bar codes, but are more easily customised and allow you to access internet sites and download content to your mobile without having to type in a URL or go searching through Google.
We created a QR code for the Mr Science mobile site - it's that black and white bar-code looking thing on the left.
To use a QR code, you need a camera in your phone - they all do these days - and you need QR software - grab it from i-nigma if you don't already have it. Open up the i-nigma application and hold your camera near the code. Your mobile then reads and analyses the code and takes you to the page it is encoding. Try it on our QR code - it works on a computer screen.
In Japan, everything from restaurant menus to competitions on train station walls have associated QR codes so you can enter the competition or order from the menu on-the-go. You could use a QR code as a business card if you liked. Various places around the world are starting to use QR codes. The Brooklyn Public Library uses the codes to identity each of their branches, which they then add to flyers and posters. The Powerhouse Museum used QR codes for Sydney Design 08.
For more information, see bibliothekia and ReadWriteWeb.
Saturday, 29 November 2008
Climate Change News and closing in on 100 episodes
This week on the podcast, we take a look at the latest climate change news, and start reflecting on the science year that was, as we close in on 100 podcast episodes (this is episode 92).The news items we discuss this week are:
- CO2 build-up in the atmosphere may prevent a coming ice-age. Ice-ages occur roughly every 100,000 years and are possibly due to small shifts in Earth's orbit which change the amount of solar energy hitting the surface. A build-up of CO2 and its associated heating may warm the Earth so much that the next ice-age is skipped. Humanity has burnt about 300 gigatonnes of carbon from fossil fuels during its existence, and even if only 1000 gigatonnes are eventually burnt (from total reserves of about 4000) then it is likely that the next ice age will be skipped, whilst the next five could be skipped if all recoverable fossil fuels were burnt. For more information, see the story at ABC Science;
- The bouquet of wine reflects the amount of fossil-fuel derived CO2 in the air at the time and place of the growing of the grapes. Carbon-14, an isotope of carbon, is made when Nitrogen atoms high in the atmosphere absorb neutrons from space (cosmic rays) . Over time, Carbon-14 decays to Nitrogen-14 , and so fossil fuels, made millions of years ago from decaying organic matter, contain almost no Carbon-14. Therefore, when fossil fuels are burned, the resultant CO2 is almost Carbon-14 free. As CO2 is used by plants to grow, the amount of Carbon-14 in the atmosphere at the time of growing is reflected, in this case, in the wine's bouquet. A low level of Carbon-14 means there was a lot of fossil fuel generated CO2 in the atmosphere at the time of growing. More information on Discovery Science;
- Wind farms could steer storms. Future mega-wind farms for renewable energy generation could have a massive effect on the weather because the large wind speeds they generate could cause disrupted air-ripples that spread out like waves over massive areas. The waves could even steer storms on the other side of the globe. More information on Discovery Science;
- Tibetan glaciers are melting faster than ever seen before. The Himalayan glaciers are melting so fast that the usual techniques for dating glaciers can't be used. Glaciers can be dated by looking for traces of leftover radioactivity from US and Soviet atomic bomb tests in the 1950s and 1960s. In the Tibetan samples, there are no signs at all of these tests, and the exposed surface of the glacier dates to 1944. More information at ABC Science;
We also start reflecting on the year that was with my much better-half Eugenia, who had to put up with me recording this here little podcast, and then having to listen to the episodes and smile! Her highlights from the year?
- The no-brainer research that said in the UK you should wear thick-clothes, especially denim, to protect yourself from skin-cancer. We never saw the sun over the 2007 summer anyway...
- And on from this show, the Science of Sumo wrestlers - we employed the sumo diet on our recent travels.
Wednesday, 26 November 2008
That time again - Movember
This year, the Mr Science Show has again entered the charity moustache growing contest, Movember. Movember supports men's-health charities, and this year in Australia, all money raised is going towards the Prostate Cancer Foundation of Australia and beyondblue - the national depression initiative. These issues are close to my heart as people close to me have suffered, and even died, because of prostate cancer and depression. Read more about the Fundraising Outcomes.Did you know:
- Depression affects 1 in 6 men....most don't seek help. Untreated depression is a leading risk factor for suicide.
- Last year in Australia 18,700 men were diagnosed with prostate cancer and more than 2,900 died of prostate cancer - equivalent to the number of women who will die from breast cancer annually.
- The science of moustaches;
- Movember time-lapse from 2006;
- My photos from the 2006 and 2007 events.
Thanks y'all!
Wednesday, 19 November 2008
Science on Stage
Dr Christopher Pettigrew, a post-doctoral researcher at the Department of Biochemistry in University College Cork, is no stranger to putting science on stage.With the 2009 AAAS Dance your PhD competition up-and-running, we decided for this week's episode of the podcast to chat to Chris about his experiences in the public performance of science.
Chris has been involved in the communication of many difficult subjects through artistic means, such using interpretive dance to explain the Australian Goods and Services Tax (GST) and DNA . Chris plans on building upon his experiences in Australian theatre whilst in Cork, Ireland. As Dr Pettigrew says:
"Nothing says Double Helix like a rapid twirl."
Listen to his podcast here:
The 2009 AAAS Dance your PhD final contestants have been selected. To read more about them and watch their videos, visit The 2009 AAAS Science Dance Contest homepage.
Do you have any scientific ideas that you would like to see put on stage? Please let us know by leaving a comment here, or by emailing us.
Thursday, 13 November 2008
Football Manager Lifetimes
I put this story together for Plus - I'll be writing their new regular Sports Column, which will focus on maths and sport. For more maths stories on sport, see previous Plus stories tagged with sport. And for more on this particular story, see it as published in The Plus Sports Page: Power TripBeing the manager of a Premier League football club may seem like one of the most glamorous jobs in the world — with the fame comes fortune and the opportunity to travel (well, to Hull, Wigan and Portsmouth anyway). However, as far as job security goes, football managers live on the edge. Their terms can be terminated almost on a whim by their club's owner, and they live and die by their team's results.
It would seem that there is no way to predict how long their tenures will be. However, a collection of researchers from the UK, Singapore and the US have found that there may be a strong mathematical trend underlying how long football managers stay in their jobs.
Toke S. Aidt, Bernard Leong, William C. Saslaw and Daniel Sgroi found that the distribution of tenure lengths for managers of sporting teams in many countries obey power laws. Power laws are fascinating because they arise in a surprisingly large number of naturally occurring phenomena, such as the size of cities, stock market returns, cook book ingredients and even how many times certain words are used in long books.
A power law has the form
|
where x and y are variables and a and b are constants. The exponent b is usually negative, so y decreases as x increases. In the case of football managers, the researchers found that
|
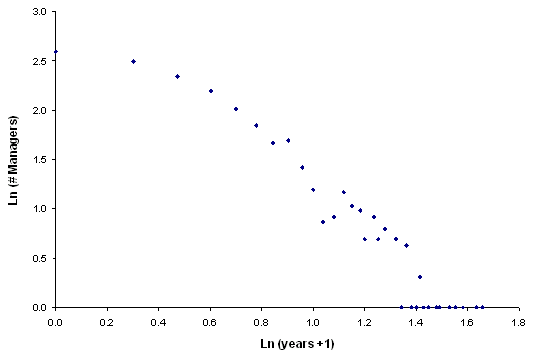
To derive this formula, the authors plotted tenure lengths of real managers against their time of dismissal and then set out to find the curve that best describes the data. In fact, to make things easier, they looked at logarithms, which turn a curve of this form into the straight line
|
For tenures greater than one year, they found that in the English Premier League, football leagues across Europe, and American football and baseball competitions, there is a straight line of this form that fits the data. Moreover, the fit is statistically significant, that is, it’s not just due to chance.
The following graph is for English Premier League managers between 1874 and 2005.
The logarithm of the length of managers' career plotted against the logarithm of the number of managers dismissed at that time of their career. The data can be approximated by a straight line and the fit is statistically significant. The data come from the English Premier League between 1874 and 2005.
But what does all this mean?
As we mentioned earlier, power laws are compelling as they can emerge from simple mathematical rules — the power law is often a macroscopic outcome of microscopic interactions between the players in the system (in this case football managers, the team, club owners and fans, etc). In fact, power laws are often seen as the signature of complexity. In the 1980s scientists found that there are dynamical systems based on simple rules which, through self-organisation, bring themselves into extremely sensitive states, where even the smallest change can cause wide-ranging and unpredictable chain reactions.
An often quoted example of this phenomenon involves a pile of sand. When you sprinkle sand on a table, a pile will build up and after a while reach a maximal slope: any additional grain of sand will cause avalanches whose number and size are impossible to predict. Such a sensitive state is called a critical state and this behaviour is called self-organised criticality. It is an interesting phenomenon, because it may explain "spontaneous" emergence of complexity in nature, which is not a result of someone forcing the system.
When a system has reached a critical state through self-organisation, it can often be described by power laws. In our sand example, the size distribution of the avalanches follows a power law. Power laws reflect complexity because they are similar on all scales. Suppose that the number n of avalanches of size s is described by the power law
|
for some constants a and b. Now multiply s by a large number c, so you're now looking at large avalanches. These then follow the power law
|
which, apart from the constants involved, is essentially the same as that for smaller avalanches - the same type of behaviour occurs on all scales.
Given that the power law highlights the fact that there is something interesting going on, the researchers set out to find out what it was. What are the simple rules of football management that govern this system, and is there self-organised criticality?
The model
The authors constructed a model which includes a manager's reputation — this is either enhanced or diminished, depending on the result of each match. The core of the model is a round-robin tournament with 20 teams playing each other once at home and once away — just like in the Premier League. The probabilities of win, lose and draw were modelled as 37%, 26%, 37%, respectively — these probabilities are those observed in the English football league between the years 1881 and 1991 and are assumed to be independent of the managers involved.
The model starts with 20 randomly selected managers, each with a given reputation and tenure. (With a nod to realism, we will henceforth assume that all managers are male.) The initial reputation of each manager is described by a positive whole number, which is chosen at random from the numbers between the firing threshold and the poaching threshold (more on these in a moment). Each manager also starts with a random tenure length between 1 and 40 years. The managers gain reputation (+ 2 points in the model) every time their teams win, and lose reputation (-2 points) when their teams lose. There are no points for draws. Each game has equal importance and so each result is equally important for a manager's reputation.
The length of a manager's tenure depends on how his reputation evolves. Termination of tenure can occur for four reasons:
- The manager loses his job when his reputation falls below the firing threshold — that is, he is sacked;
- The manager is poached by another club when his reputation reaches the poaching threshold — that is, he gets a better deal;
- The manager retires if he gets too old (another parameter that can be varied);
- The manager's team is relegated to a lower league because it has the lowest reputation at the end of the season — the team is demoted out of the league.
When a manager leaves the system — that is, he is either fired or poached, relegated or retired — his place in the league is taken by another manager with tenure length of zero and a random starting reputation.
With these rules in place, the researchers ran many simulations, varying the random parameters in each run. Such a process is known as a Monte-Carlo simulation. They recorded the distribution of tenure lengths corresponding to one hundred years of competition. They found that for a very broad range of starting parameters, the model produced a tenure length distribution statistically indistinguishable from a power-law distribution. Similar results were obtained for different probability distributions of win, loss or draw. However, the researchers also found that power laws only emerge when a win enhances reputation by the same amount as it is decreased by a loss, and when each match has equal importance. The latter makes sense if you think that the aim of a Premier League team is to maximise its profit: you need to fill the stadiums and make as much advertising revenue as you can at each game. And as the Premier League is a first-past-the-post competition, each win has equal worth on the league table, with position on the table more than anything guaranteeing further advertising and merchandising returns.
Coming back to self-organised criticality, the researchers admit that their model does not prove the existence of this phenomenon in the world of sport. In fact, the model is not quite as self-organising as it could be, since certain parameters need to be artificially fixed at the outset. They do believe, however, that certain other factors point in the direction of self-organised criticality. The Premier League, they postulate, follows the Red Queen principle: it is an arms race where constant development is needed simply to compete. This explains why once a league has reached a self-organised critical state, it might stay there for a prolonged period of time. It is simply too difficult for a team to shake up the system, given that they are already in a process of continual change in order to stay with the pack. The term Red Queen comes from Lewis Carroll's Through the Looking-Glass in which the Red Queen says: "It takes all the running you can do, to keep in the same place".
What the results surprisingly show is that ability and talent, although obviously playing some role, do not play a major role in a manager's success. His survival is far more determined by the sacking and poaching thresholds and simple randomness in his team's results. 2007 Chelsea manager Avram Grant is a good example of this: as he started his tenure with a low reputation, despite his team's good results, probabilities took their toll and he was sacked at the end of the season.
In any case, it's hard to feel sorry for prematurely sacked Premier League managers when their average salaries are over £2 million.
For more info, see the following:
- The paper A power-law distribution for tenure lengths of sports managers has appeared in the journal Physica A;
- The Plus article Understanding uncertainty: The Premier League finds more randomness in the Premiere League;
- There is more about sand pile models in the Plus article Like sand through the hour glass;
- And about power laws in the Plus articles The mystery of Zipf, Network news, and Beating bird flu with bills.
Thursday, 6 November 2008
Here's why we need science communicators
When I was a kid, we never had drought after drought.
Then we started with daylight saving. We started with a little bit, but now we have six months of the year daylight saving. It has just become too much for the environment to cope with.
It is so logical, for six months of the year we have an extra hour each day of that hot afternoon sun.
I read somewhere that scientific studies had shown there is a lot less moisture in the atmosphere which means we get less rain.
I believe this one hour extra sun is slowly evaporating all the moisture out of everything. Why can't the government get the CSIRO to do studies on this, of better still, get rid of daylight savings.
They have to do something before it is too late.
CHRIS HILL, Albury
... And that's why we need science communicators!
This has also been reported in Failblog and somewhere in the smh.